Audit the construction of auction profiles
Reconstruct POC ties, value-area coverage, composite sessions, TPO counts and price-grid effects using original, checkable datasets.
What you will practise
Explain why a profile level changes by checking its population and calculation rules before assigning a trading narrative.
Before you start
- Identify a volume-profile maximum and calculate trade-level VWAP.
- Distinguish an observation window from a forecast or trading signal.
Course outline
- 1
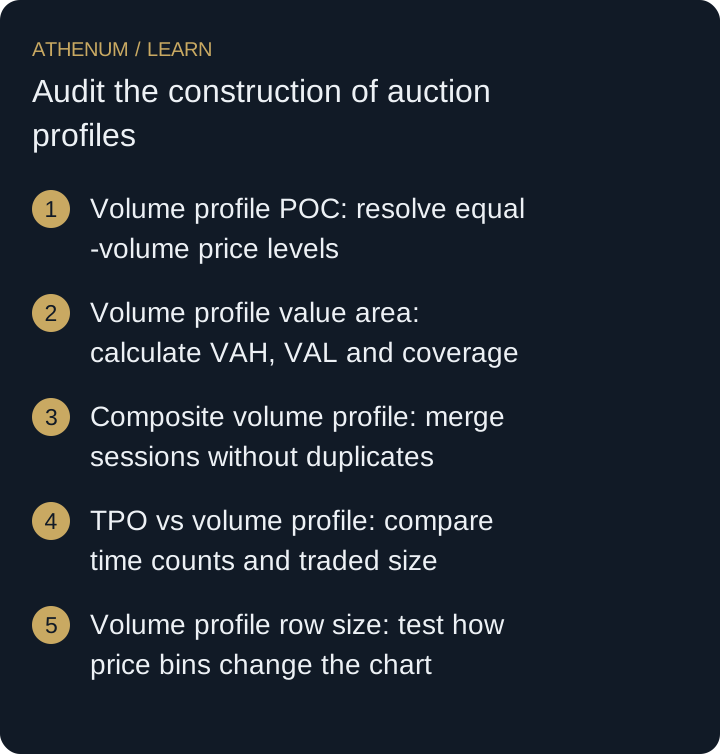
Volume profile POC: resolve equal-volume price levels
Calculate which price a volume profile selects when several rows share the maximum. Test how a tie-breaking rule can change the displayed POC.
7 min - 2
Volume profile value area: calculate VAH, VAL and coverage
Build a value area from complete price rows. Compare stopping rules and calculate why actual volume coverage can differ from the chosen 70% target.
8 min - 3
Composite volume profile: merge sessions without duplicates
Build a composite volume profile from aligned session rows. Check boundary trades and explain why averaging session POCs gives the wrong calculation.
8 min - 4
TPO vs volume profile: compare time counts and traded size
Build TPO and volume profiles from the same original ledger. Explain why their points of control can differ without either calculation being wrong.
7 min - 5
Volume profile row size: test how price bins change the chart
Rebuild one trade ledger with different bin widths and origins. Compare bucket-midpoint VWAP estimates with the exact trade-level calculation.
8 min
 Open full-size diagram
- Volume profile POC: resolve equal-volume price levels
- Volume profile value area: calculate VAH, VAL and coverage
- Composite volume profile: merge sessions without duplicates
- TPO vs volume profile: compare time counts and traded size
- Volume profile row size: test how price bins change the chart
Educational material. Examples do not establish a profitable strategy. Trading costs, gaps and liquidation can produce losses beyond a planned stop.