Audit open-interest data before interpreting it · 5 / 5
Aggregate long/short ratios: weight account counts correctly
Averaging two percentages is not the same as pooling their underlying populations. Keep denominators visible so changing weights do not become a misleading positioning story.
Athenum8 minUpdated:
Task and population contract
Construct an aggregate long-holder proportion from its numerator and denominator, then separate changes within venues from changes in their weights. This is a mathematical example, not a reconstruction of a named provider's accounts. Each observation counts venue-account records for one specified instrument population. Long and short categories are mutually exclusive and exhaustive in this toy dataset. Accounts can hold unequal quantities, so these counts do not determine outstanding contract sizes.
Equal-venue averaging is a different statistic
The unweighted average of the two venue proportions falls from 55% to 45%. That is a legitimate equal-venue index if clearly labelled, but it is not the pooled holder proportion. It assigns the ten-holder venue the same weight as the hundred-holder venue. Neither statistic measures the share of dollars positioned long, and neither is automatically the best trading signal.
A provider publishing only rounded percentages does not supply the missing holder counts. Do not infer them from OI, traded volume or market share: those are different denominators. With percentages alone, pooled holder proportion is unidentified unless trustworthy count weights are supplied.
Hold the starting weights fixed
As a diagnostic, apply t0's holder weights (10/110 for A and 100/110 for B) to t1's venue proportions. The result is (10×0.8 + 100×0.1)/110 = 18/110, or 16.3636…%. This standardized index falls ten percentage points from the initial pooled proportion, consistent with the within-venue declines.
The actual t1 proportion is 81/110. Relative to that particular standardization, the weight change contributes (81−18)/110 = 57.2727… percentage points; combined with the -10-point within-venue term it reconciles the observed +47.2727…-point change. This is one explicitly ordered arithmetic decomposition, not a causal estimate. Different weighting conventions define different counterfactual indices. State the choice instead of hiding it in a chart label.
Work from counts
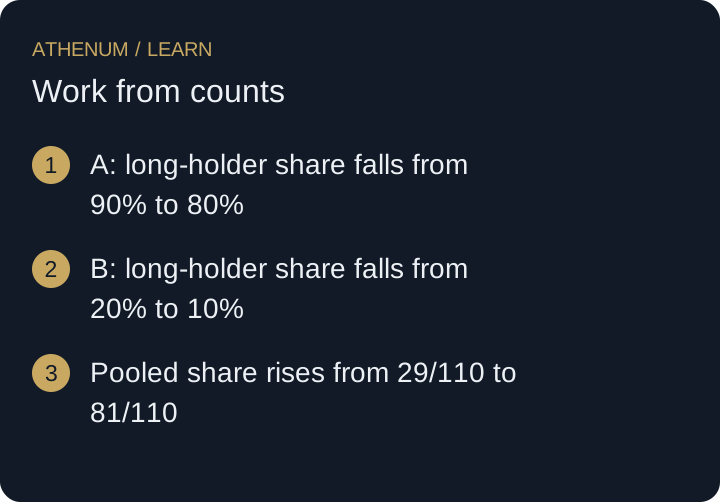
A's long proportion falls from 9/10 = 90% to 80/100 = 80%. B's falls from 20/100 = 20% to 1/10 = 10%. Each venue falls ten percentage points. Yet the pooled long proportion rises from (9+20)/(10+100) = 29/110, or 26.3636…%, to (80+1)/(100+10) = 81/110, or 73.6363…%.
This is not an arithmetic contradiction. The larger population switches from the low-proportion venue B to the high-proportion venue A. Total holders remain 110 in both snapshots, but that does not establish a stable cohort or identify any particular person's change of position. The counts alone cannot tell whether accounts migrated, entered, exited or were reclassified.
| Venue | t0 long holders | t0 total holders | t1 long holders | t1 total holders |
|---|---|---|---|---|
| A | 9 | 10 | 80 | 100 |
| B | 20 | 100 | 1 | 10 |
 Open full-size diagram
- A: long-holder share falls from 90% to 80%
- B: long-holder share falls from 20% to 10%
- Pooled share rises from 29/110 to 81/110
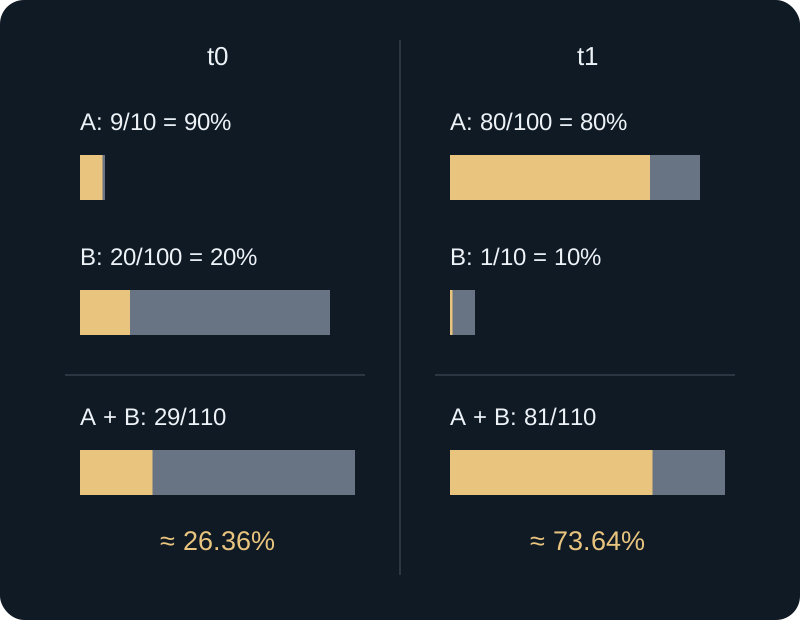
Two complete fictional venue-account populations at two snapshots. The high-share venue receives a larger count weight at t1. This compares venue and pooled proportions; it is not a sequence of trades.
t0 long holders; t1 long holders.
Failure case: records are not unique people
Even correct pooling counts venue-account records, not necessarily distinct people across exchanges. The same person can have records at both venues. Without lawful, reliable cross-venue identity information, report the record population rather than claiming 110 unique traders. No private account linkage is needed or proposed for this lesson. Likewise, a venue's top-trader cohort cannot silently replace its all-holder population during aggregation.
Before acting
- Identify compatible populations before pooling counts.
- Sum numerators and denominators, not unweighted ratios.
- Label equal-venue indices and fixed-weight comparisons explicitly.
- Separate within-venue changes from composition effects.
- Do not call cross-venue account records unique people.
Check your understanding
At a new snapshot, A has 30 long holders out of 50; B has eight out of 40. Calculate the pooled long proportion, equal-venue average and pooled long-to-short count ratio. Can averaging the two venue long-to-short ratios recover that pooled ratio?
Show the explained answer
Pooled long proportion is 38/90 = 42.2222…%; equal-venue average is (60%+20%)/2 = 40%. Short holders total 20+32 = 52, so the pooled long-to-short count ratio is 38/52 = 0.730769…. Venue ratios are 30/20 = 1.5 and 8/32 = 0.25; their arithmetic average 0.875 is not the pooled ratio. Recover it from compatible counts, not by averaging differently weighted ratios. If only 60% and 20% were supplied, 42.2222…% would not be justified without the corresponding denominators.