Trading statistics: test what a backtest result actually says
Interpret compounding, profit factor, overlapping trades, net benchmarks and bootstrap assumptions with independently calculated examples.
What you will practise
Separate a correct historical calculation from evidence strong enough to support a new trading hypothesis.
Before you start
- Calculate net expectancy and understand chronological holdouts.
- Read trade-level R multiples and account equity as different quantities.
Course outline
- 1
Average return versus compound growth: reconcile the equity curve
Calculate arithmetic average return and compounded account growth from the same sequence. Explain volatility drag and why trade R is not account return.
7 min - 2
Profit factor: check whether one winner carries the result
Calculate profit factor from net trade outcomes, then inspect winner concentration. Keep sensitivity analysis separate from deleting inconvenient trades.
7 min - 3
Overlapping trades: why twenty results may contain four market episodes
Map overlapping holding windows before interpreting a sample size. Separate trade count, independent information and simultaneous account exposure.
7 min - 4
Trading benchmark: compare net results on the same capital and dates
Compare a strategy with a declared benchmark after costs, cash flows and exposure differences. Avoid calling gross outperformance investment skill.
7 min - 5
Trading bootstrap: preserve dependent blocks when resampling results
Enumerate a tiny trade-versus-day bootstrap to see how the resampling unit changes uncertainty. Explain why more simulations do not create more market history.
7 min
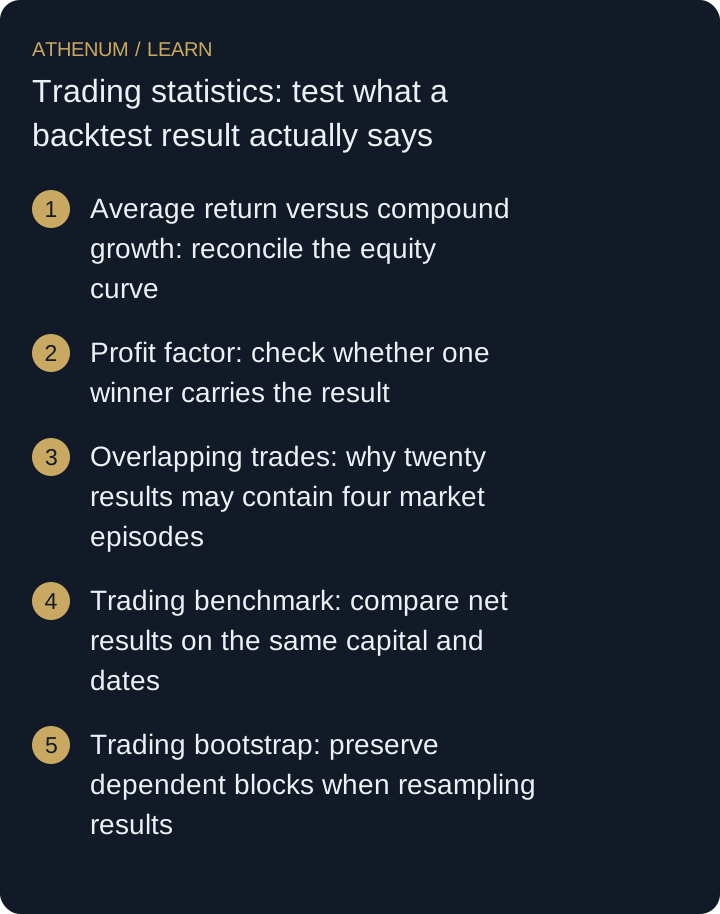 Open full-size diagram
- Average return versus compound growth: reconcile the equity curve
- Profit factor: check whether one winner carries the result
- Overlapping trades: why twenty results may contain four market episodes
- Trading benchmark: compare net results on the same capital and dates
- Trading bootstrap: preserve dependent blocks when resampling results
Educational material. Examples do not establish a profitable strategy. Trading costs, gaps and liquidation can produce losses beyond a planned stop.