Trading statistics: test what a backtest result actually says · 1 / 5
Average return versus compound growth: reconcile the equity curve
A sequence can average zero percent while losing capital. Arithmetic means add observations; an equity curve multiplies return factors. The distinction matters whenever gains and losses apply to a changing amount of capital.
Athenum7 minUpdated:
Use returns on a consistent capital base
For n equally defined periods, arithmetic mean return is Σr_i / n. With no external cash flows, compounded growth is Π(1 + r_i) − 1. The geometric average per period is the product raised to 1/n, minus one, when the positive wealth factors make that expression meaningful.
Trade-level R multiples are not automatically account returns. A +2R trade with a 0.5% account-risk allocation differs from +2R with a 2% allocation. Concurrent positions and unused cash also change the mapping. Build the account curve from the actual capital and P&L convention before interpreting its average.
Separate final wealth from path risk
For fixed percentage returns applied to the full account with no cash flows, rearranging the same factors leaves their final product unchanged. It can still change drawdown and the experience of holding the strategy. If sizing, cash flows or stop policies depend on the path, changing order can also change the realized returns themselves.
Volatility drag describes the difference between arithmetic and compound growth under a specified return process. It is not an extra brokerage fee to subtract again. Costs should already be included in each net return; adding a separate drag deduction to the exact compounded product would double-count the effect.
Worked example: two zero-average sequences, different wealth
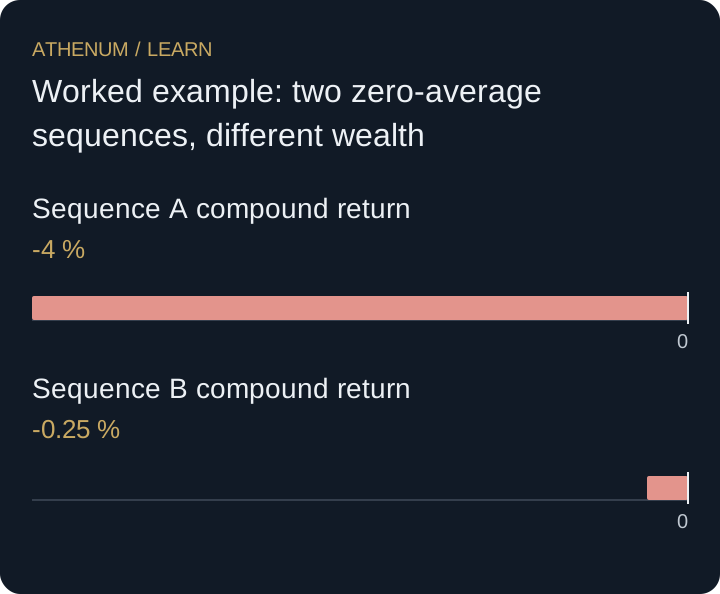
Start with a hypothetical 10,000-USDT account. Sequence A earns +20% and then −20%, so its arithmetic mean is 0%. Equity goes to 12,000 and then 9,600, producing −4% total growth. Sequence B earns +5% and then −5%, also averaging 0%, but ends at 9,975, or −0.25%.
The geometric period averages are √0.96 − 1 ≈ −2.0204% and √0.9975 − 1 ≈ −0.1251%. The different final balances arise directly from multiplying the factors. These are constructed net-return sequences; no inference about a particular strategy’s future volatility follows.
| Sequence | Period 1 | Period 2 | Arithmetic mean | Final equity |
|---|---|---|---|---|
| A | +20% | −20% | 0% | 9,600 USDT |
| B | +5% | −5% | 0% | 9,975 USDT |
 Open full-size diagram
- Sequence A compound return: -4 %
- Sequence B compound return: -0.25 %
Do not multiply the average into a return promise
An observed 1% mean trade return multiplied by 100 trades is not a guaranteed 100% account gain. Returns may overlap, use different capital, incur changing costs or be selected from a favorable period. Even a correctly compounded historical curve remains a sample rather than a forecast.
Before acting
- Define account returns and their capital base.
- Use the product of return factors for growth.
- Retain the chronological curve for drawdown.
- Separate trade R, arithmetic averages and geometric growth.
Check your understanding
An account earns +10%, −10% and +5%, with no cash flows. What are its arithmetic mean and total compounded return?
Show the explained answer
The arithmetic mean is (10 − 10 + 5) / 3 = 1.6667% per period. The wealth factor is 1.10 × 0.90 × 1.05 = 1.0395, so total compounded return is 3.95%. Applying that factor to 10,000 gives 10,395.