Table of Contents8 sections
- How concentrated is Bitcoin open interest across exchanges?
- Why does a counting convention move an index built from shares?
- Where does the difference actually land inside the index?
- How do you compute the HHI for crypto exchanges?
- What does a score of 2,552 actually mean?
- Did concentration move when the market moved?
- What does this measure not tell you?
- How can you reproduce these numbers?
Practise with worked lessons
- Open interest data gaps: compare a consistent venue panel
Separate real open interest changes from missing, stale or restored venue data. Reconcile visible totals against the same exchange panel at each timestamp.
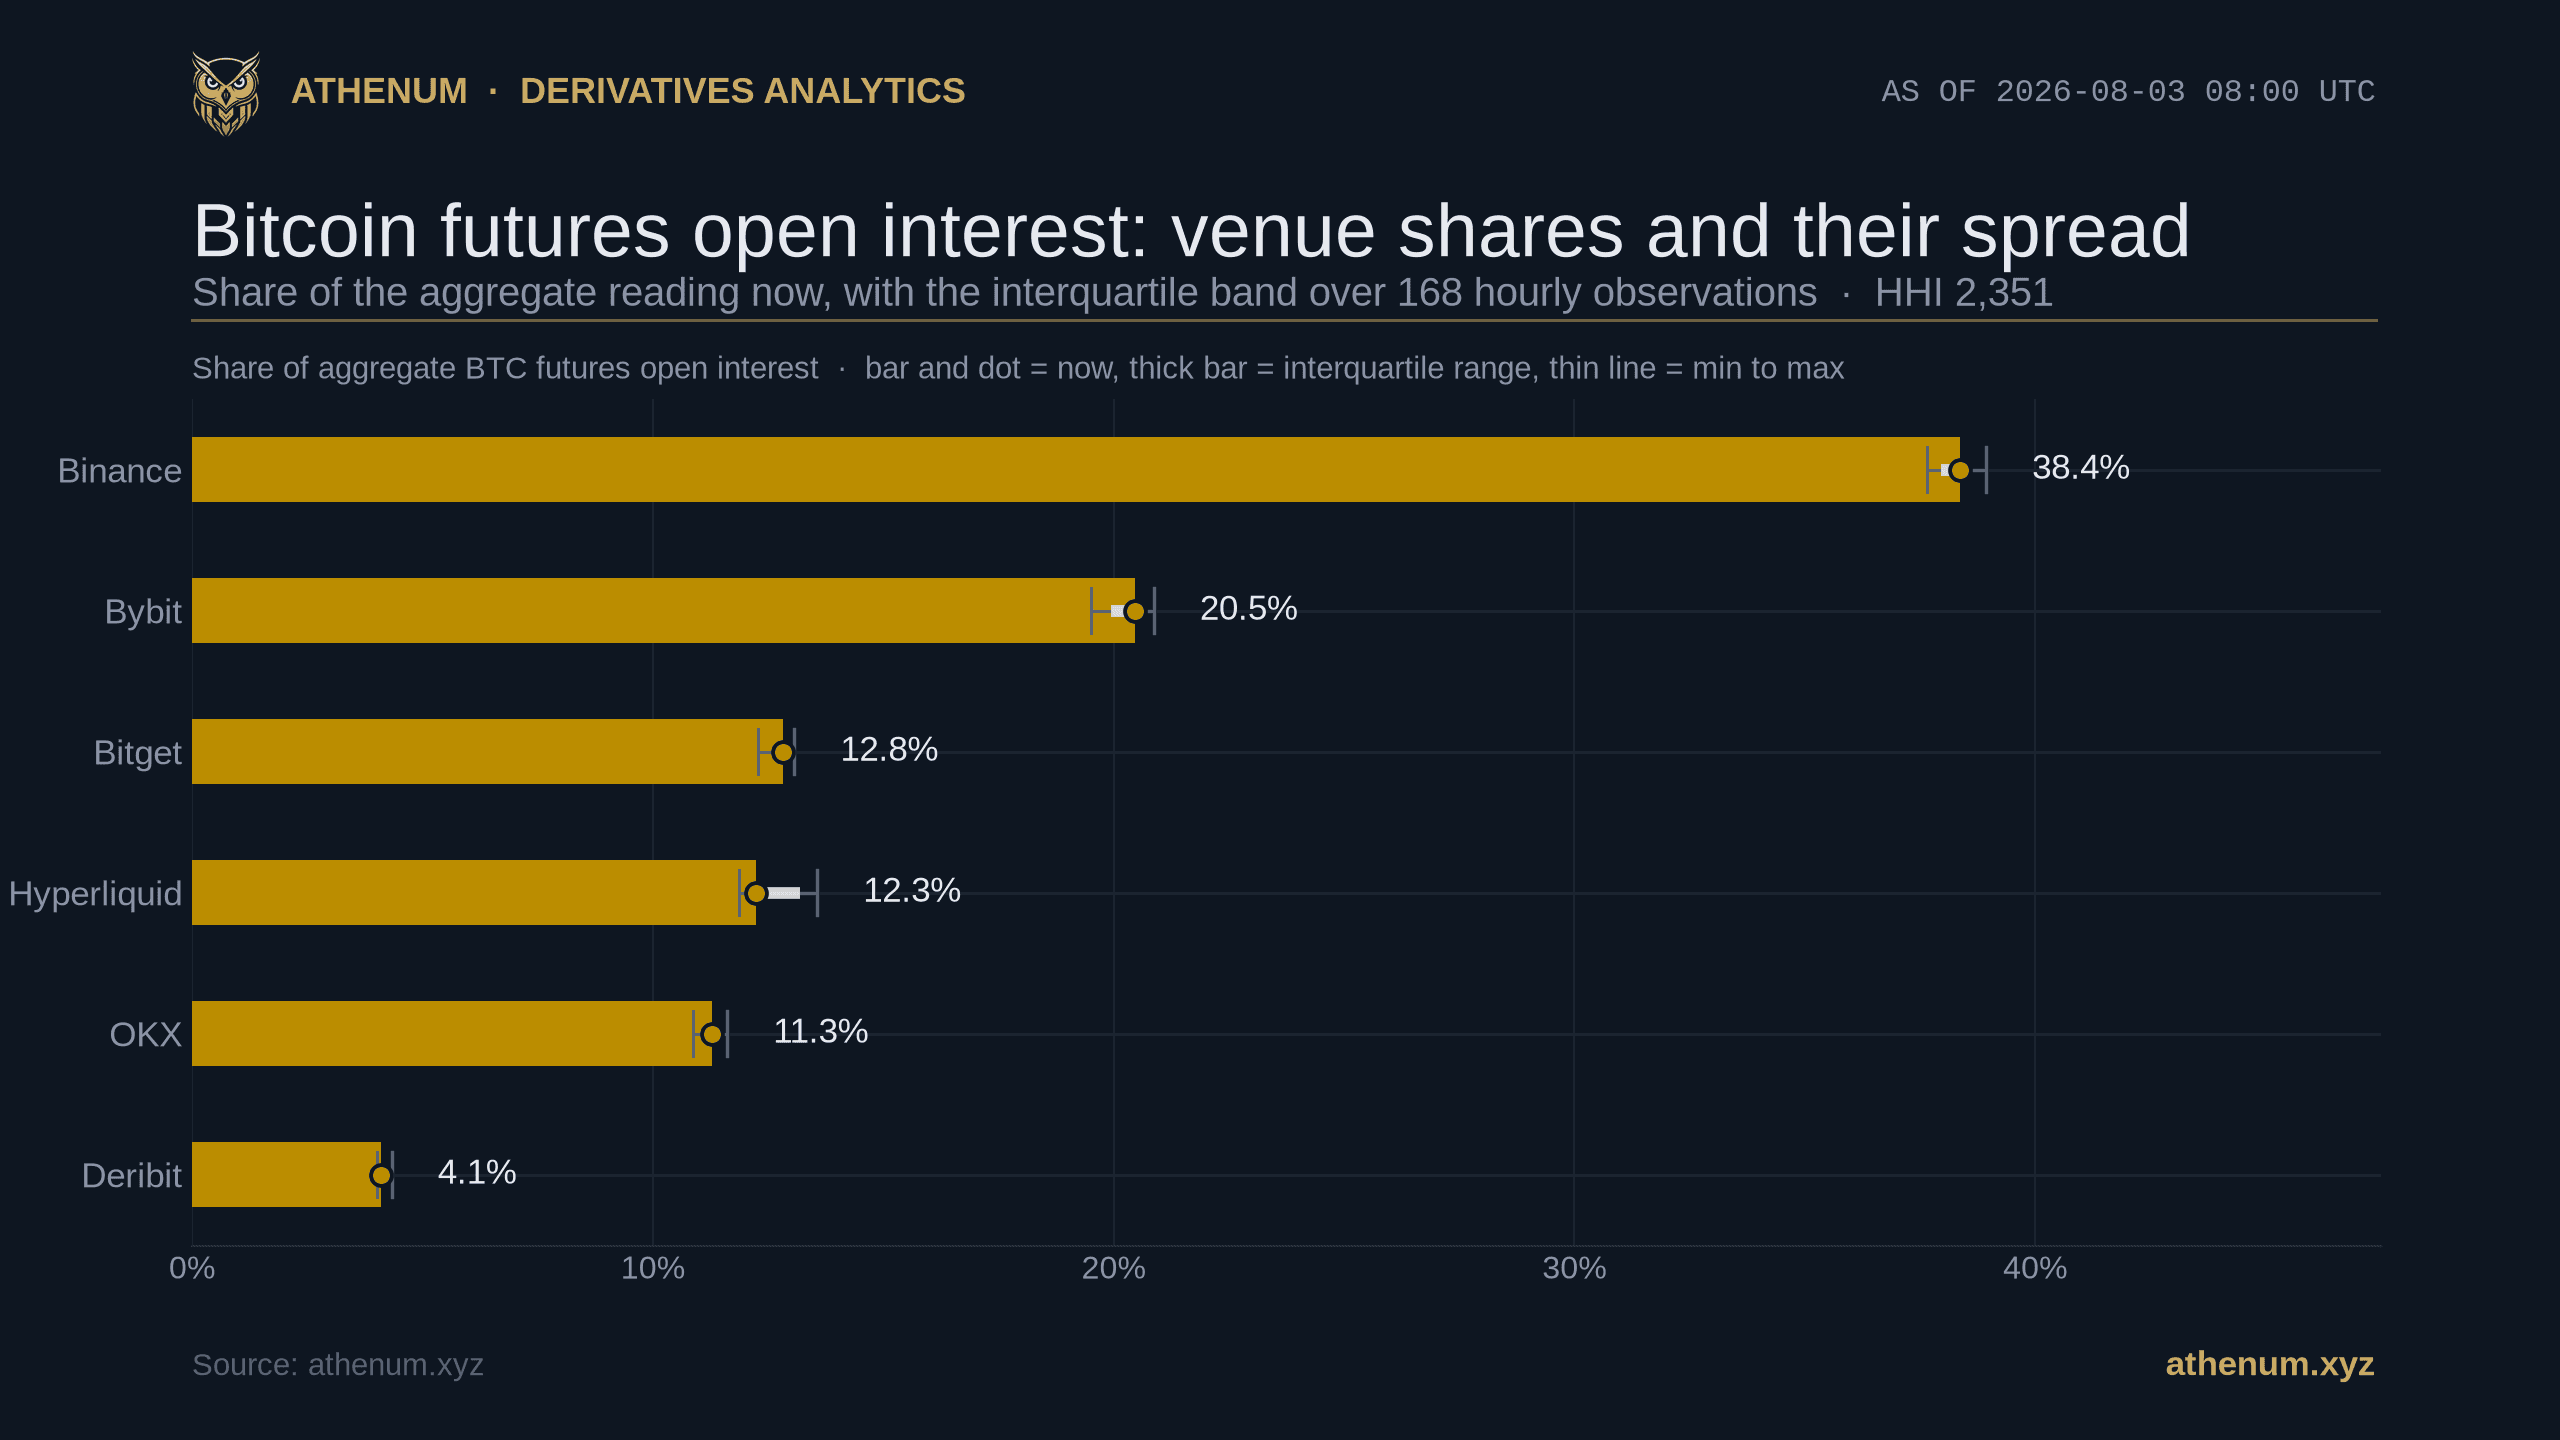
TLDR. Bitcoin open interest concentration is how unevenly the open positions in Bitcoin futures sit across the venues that hold them, scored with the index competition regulators use on any other industry: the Herfindahl-Hirschman Index, the sum of the squared percentage market shares. Because it is built from shares rather than sizes, it looks immune to how each venue counts. It is immune, but only if every venue counts the same way, and there is no way to establish from what they publish that they do. Bybit documents its open interest field as the sum of both sides of every contract and publishes a single-side field beside it whose ratio is exactly two. Bitget states in writing that its platform figure is bilateral. The other four do not state it in their API references. So on 2026-08-05 at 09:00 UTC the same six readings give 2,376 if all six count both sides, 2,552 if only Bybit does, and 2,784 if Bybit and Bitget both do. Across all 168 hourly readings in this window the first two of those stay between 175.8 and 192.3 points apart, which is wider than the 83 points the index itself spanned all week, and each convention puts a different venue in second place.
Correction, 2026-08-05. The first edition of this post, published on 2026-08-03, printed one number, 2,351, and said it was accurate to within half a point. The arithmetic was right and the premise went unchecked: it assumed the six venue figures were counting the same thing. It also took each share of the venue aggregate our feed reports rather than of the six legs themselves, which is the base this edition uses; on the latest reading those two bases differ by about 0.7 percent. This edition is a rewrite rather than a patch. It recomputes on today's readings, replaces the single number with the range the evidence actually supports, and keeps the uncorrected reading in view instead of quietly retiring it. Sections of the first edition are gone where the counting question replaced what they were arguing about.
How concentrated is Bitcoin open interest across exchanges?
The honest answer is a range, and the range is wide enough to matter. On 2026-08-05 at 09:00 UTC, with Bitcoin near $64,100, the six venues' own published figures add to $18.00B and produce an index of 2,376. Put Bybit's leg on one side, using the single-side field Bybit publishes itself, and the six add to $16.10B for an index of 2,552. Apply the same treatment to Bitget and they add to $14.93B for 2,784. Same instant, same six readings; the only thing that changes is whether a leg is counted once or twice.
Which of those three is right depends on facts four of the six do not publish. If every one of the six counts both sides, the factor of two cancels out of every share and 2,376 is correct. If only Bybit does, 2,552 is. Read back as a venue count, that is the difference between about 4.2 equal-sized venues and about 3.9, or about 3.6 under the widest correction. What can be established today is the spread, not the point inside it.
Why does a counting convention move an index built from shares?
This is the part worth keeping, because the intuition runs the other way. A share is a ratio, and a ratio is blind to a scale factor applied to everything in it. Double every venue's figure and every share is unchanged, so the index is unchanged. That is exactly why a concentration score feels safer to quote than a raw total: the units cancel.
They cancel only when the factor is common. The moment one venue counts both sides and another counts one, the factor stops being a scale and becomes a distortion, and it lands entirely on the venues that differ. A cross-venue total is wrong by the size of the mis-counted leg, which is bounded and easy to reason about. A share-based index is either exactly right or wrong by a lot, and which one it is depends on documentation most venues do not publish. That asymmetry is the reason this post exists and it is not visible in the number.
Across the 168 hourly readings from 2026-07-28 13:00 UTC to 2026-08-05 09:00 UTC the published index spanned 83 points, between 2,338 and 2,421. The single Bybit substitution is worth between 175.8 and 192.3 points over the same hours. So a convention almost nobody prints separates two readings by more than the whole band the metric occupied all week. That is the practical test of whether a data detail is pedantic: if fixing it moves the answer less than the thing moves on its own, it is a footnote.
One thing the window is not: continuous. 21 hourly readings between 2026-07-31T03:00Z and 2026-08-01T01:00Z were never taken, a 22 hour step between two consecutive bars, so the 168 observations here cover 188 hours of clock time. The two time-series charts draw that as a break rather than joining a line across it.

Interquartile range, full range and latest reading of the hourly index under three counting conventions. The three distributions do not overlap, so the convention decides the answer more than the week's trading does.
Where does the difference actually land inside the index?
Not, mostly, on the venue whose figure changed, and that is what makes an index behave differently from a total. The index squares each share, so the substitution reaches the total through two opposing channels, and the larger one runs through a venue nobody touched.
Bybit's own contribution falls from 445 points to 139, a drop of 306. But halving one leg also shrinks the total every other share is taken of, so every untouched venue's share rises. Binance goes from 38.3 percent to 42.8 percent without a single position changing hands, and because the share is squared its contribution climbs from 1,465 points to 1,831, a gain of 366. The 176 points between the two readings is what survives after a gain of 366 and a drop of 306 have largely cancelled, with the four smaller venues supplying the remaining 116.
Venue | Contribution as published | Contribution with Bybit on one side | Change |
|---|---|---|---|
Binance | 1,465 | 1,831 | +366 |
Bybit | 445 | 139 | -306 |
Bitget | 170 | 212 | +42 |
Hyperliquid | 157 | 196 | +39 |
OKX | 123 | 154 | +31 |
Deribit | 16 | 20 | +4 |
The mechanics of the factor of two itself, and what it does to a plain cross-venue total, are a separate question worked through in open interest one side or both.
The ordering moves too, and it moves completely: the two orderings disagree in 168 of 168 hourly readings, not in a handful of borderline hours. Neither ordering is itself stable, and the post owes you both numbers rather than one: the published order holds in 121 of 168 hours and the Bybit-corrected order in 121 of 168, because in the other 47 hours Bitget and Hyperliquid swap places with each other: third and fourth on the published figures, second and third once Bybit's leg is on one side. Those counts are computed over the most recent 168 readings, and that window rolls forward every hour, so a reader who re-runs this tomorrow should expect the tally to move even if nothing else does.
How do you compute the HHI for crypto exchanges?
The index is deliberately simple, which is why it survives arguments. Four steps, and the first is the one that is usually skipped:
1. Put every venue on the same convention first. Check whether each venue's published open interest counts one side or both. Where a venue publishes a single-side field, use it: that is arithmetic. Where it only describes its convention in material that never names the field you are reading, carry both answers rather than picking one. Where it does neither, say so. 2. Take each venue's share of the total, in percentage points rather than fractions. Binance held $6.89B of the $18.00B published total on 2026-08-05, so its share enters the sum as 38.3 and not as 0.383. The scale convention matters, because every threshold anyone quotes is calibrated to it. 3. Square every share and add them. Squaring is the entire mechanism: it makes one large share count for far more than several small ones. Six equal venues would score 1,667; these six, arranged as they actually are, score 2,552 with Bybit on one side. 4. Divide 10,000 by the result to read it back as a venue count. 10,000 divided by 2,552 is 3.92, the number of equal-sized venues that would produce the same concentration.

The same index computed two ways, hour by hour. The gap never closes: across the window the two series stay between 175.8 and 192.3 points apart. The shaded column is a break with no reading, drawn as a gap rather than joined by a line.
What does a score of 2,552 actually mean?
The 0 to 10,000 scale has published landmarks. A monopoly scores 10,000. Ten equal competitors score 1,000, and six equal competitors score 1,667, which is the worked example the 2023 US merger guidelines print in a footnote.
Which label a reading earns depends on which edition you open. The 2023 US merger guidelines put the highly concentrated line at 1,800 and pair it with a required increase of more than 100 points, so all three readings here clear the level and none of them triggers anything, because no merger has occurred to produce an increase. The 2010 edition they replaced drew the line at 2,500 and called 1,500 to 2,500 moderately concentrated. Against that retired yardstick the published 2,376 would have been labelled moderately concentrated while the 2,552 reading clears the line, and clears it in every one of the 168 hours here, the lowest being 2,514.66. A counting convention rather than a change in anyone's positions is what moves the market across that particular label, and it is worth being precise that the label in question is the superseded one.
The European Commission's operative 2004 guidelines mention 2,000 as well, but only as the edge of a safe harbour: horizontal concerns are not normally expected with a post-merger score between 1,000 and 2,000 and an increase under 250, or above 2,000 with an increase under 150, and the second of those has no upper bound. The guidelines add that these levels raise no presumption either way, and the safe harbour itself is conditional on there being no special circumstances. Anyone quoting a label owes you the edition.
Did concentration move when the market moved?
Less than the market itself did. Over the window from 2026-07-28 13:00 UTC to 2026-08-05 09:00 UTC the six-venue total with Bybit on one side swung between $15.21B and $16.22B, a span of 6.7 percent, while the index moved between 2,515 and 2,612, a span of 3.9 percent. Positions were opened and closed in volume while the proportions in which they were held moved considerably less. Treat the ratio between those two percentages as a presentational comparison rather than a measurement, since a percentage change in a sum of squares has no natural commensurability with a percentage change in a dollar total.
Note what that is and is not. It is not a claim that the shape held still: 3.9 percent is a real move, and the ranking inside it is not stable at all. What it does establish is the scale at which a single reading should be quoted. An index that jumped around every few hours would be describing noise; one that stays inside a band this narrow for a week is describing structure, and that is what makes the counting question so awkward: the gap between conventions is wider than the structure's own weekly variation.

The concentration index and the six-venue total, both with Bybit's leg on one side. The market's size spanned 6.7 percent across the window while the index spanned 3.9 percent.
What does this measure not tell you?
Five things, and they are worth more than the headline.
Which of the three readings is correct. That is the honest state of it. The evidence closes Bybit, because it publishes both figures and the ratio is exactly two. It does not close Bitget, whose bilateral statement sits in a risk-control support article that never names the market endpoint this reading uses, so binding the two together is an inference. And it says nothing at all about the remaining four.
It is not a market-power finding. The guidelines pair a threshold with a required increase, and an increase presupposes a merger. Nothing here is a merger. The index also reads concentration in markets with entry barriers and captive customers, and a perpetual venue has weaker versions of both: traders move between venues in minutes, market makers quote on all of them at once, and one position can be hedged across two books.
Nobody has defined the market, which is the strongest objection to everything above. A concentration score means something only once you have said what the market is. Narrow the frame and the score rises; widen it to regulated futures, options and spot and it falls.
Four of the six venues do not document the convention in their API references. Binance documents the field as open interest and nothing more; OKX documents its open interest endpoint by denomination only; Deribit documents the amount units and stops; Hyperliquid has no field description for these values at all. There is an OKX help-centre page describing the trading interface's open interest indicator as showing open long and short positions, but it is about a chart in the product rather than the endpoint, and the phrasing is ambiguous, so this post does not count it. Deribit's support knowledge base could not be read from here at all, so its silence is unobserved rather than established.
The scope is one perpetual contract per venue, and they are not all the same shape: five are USD-quoted linear contracts, while the Deribit leg is its inverse perpetual, quoted in USD but margined and settled in Bitcoin. Dated futures and each venue's other perpetuals sit outside this reading, and regulated venues sit outside it entirely.
How can you reproduce these numbers?
The market figures come from public endpoints that need no account; the thresholds and the 1,667 example come from the merger guidelines themselves. Bybit's ticker endpoint returns both of its open interest fields in the same response, so the factor of two is one request away. The venue announced the move to single-side reporting on 2026-05-28, effective 2026-06-11, saying displayed values would fall by around half; that announcement listed the pages it would change and added two new API fields, and the field most data pipelines read still returns the both-sides number, measured again on 2026-08-05, 55 days later.
The other five venues each publish their own open interest endpoint, and the Athenum funding rate calculator and liquidation calculator carry a per-venue figure into a position calculation without an account. The venue-level breakdown sits in open interest by exchange.
Every market number in this post is a reading of Athenum's live cross-venue derivatives feed, taken on 2026-08-05, and each venue's current reading is reproducible from its own public endpoint; the 34 calculators alongside it stay free, with no account, no email, and no usage limits. Open the terminal and re-run the arithmetic on today's readings.
One terminal. All the data.
Liquidations, orderbook depth, whale walls & open interest from 4 exchanges, all real-time, in one place.
No credit card required

Athenum Analytics
Athenum Analytics is our three-person editorial team covering crypto derivatives, market data and macroeconomic context.