Table of Contents7 sections
- What interest rate does the Bitcoin option board imply?
- How do you read a rate off a pair of option quotes?
- Is the number identified, or is it just noise with a decimal point?
- Does the option board agree with the futures board?
- Why does Ether imply a lower rate than Bitcoin 91 seconds later?
- What do perpetuals say about the same rate today?
- What this does not show
TLDR. The Bitcoin options implied interest rate is not a quoted field anywhere: it is the rate hidden inside the quotes, because an option board prices a dollar you will not receive until expiry, and you can read it out without a key. Read on 2026-10-12 at 08:37 UTC across 399 two-sided strike pairs on the full Deribit Bitcoin option board, with the index at $83,621.84, the implied continuously compounded rate runs 5.99 percent at 11 days, 5.59 percent at 74 days and 5.22 percent at 165 days. The 11 day reading carries a 95 percent fit interval of plus or minus 2.07 points; from 46 days out it is plus or minus less than a quarter of a point. The 3-month Treasury bill most recently published by the Federal Reserve Bank of St Louis, the 2026-10-08 reading of the DTB3 series, is 4.05 percent, so the Bitcoin board is asking about 1.5 points more for the same dollars, 1.46 once both are put on one compounding basis further down. Then the control that spoils the clean reading: the Ether board, read 91 seconds later on 2026-10-12, implies 4.61 percent at the same 74 day expiry, 0.97 points below Bitcoin, and a dollar rate cannot depend on which coin is posted against it. What the fit recovers is the rate at which one platform's quotes discount a dollar, not a risk free rate, and the gap between two boards on the same venue in the same pass is a published and still unexplained result rather than something this post can resolve.
What interest rate does the Bitcoin option board imply?
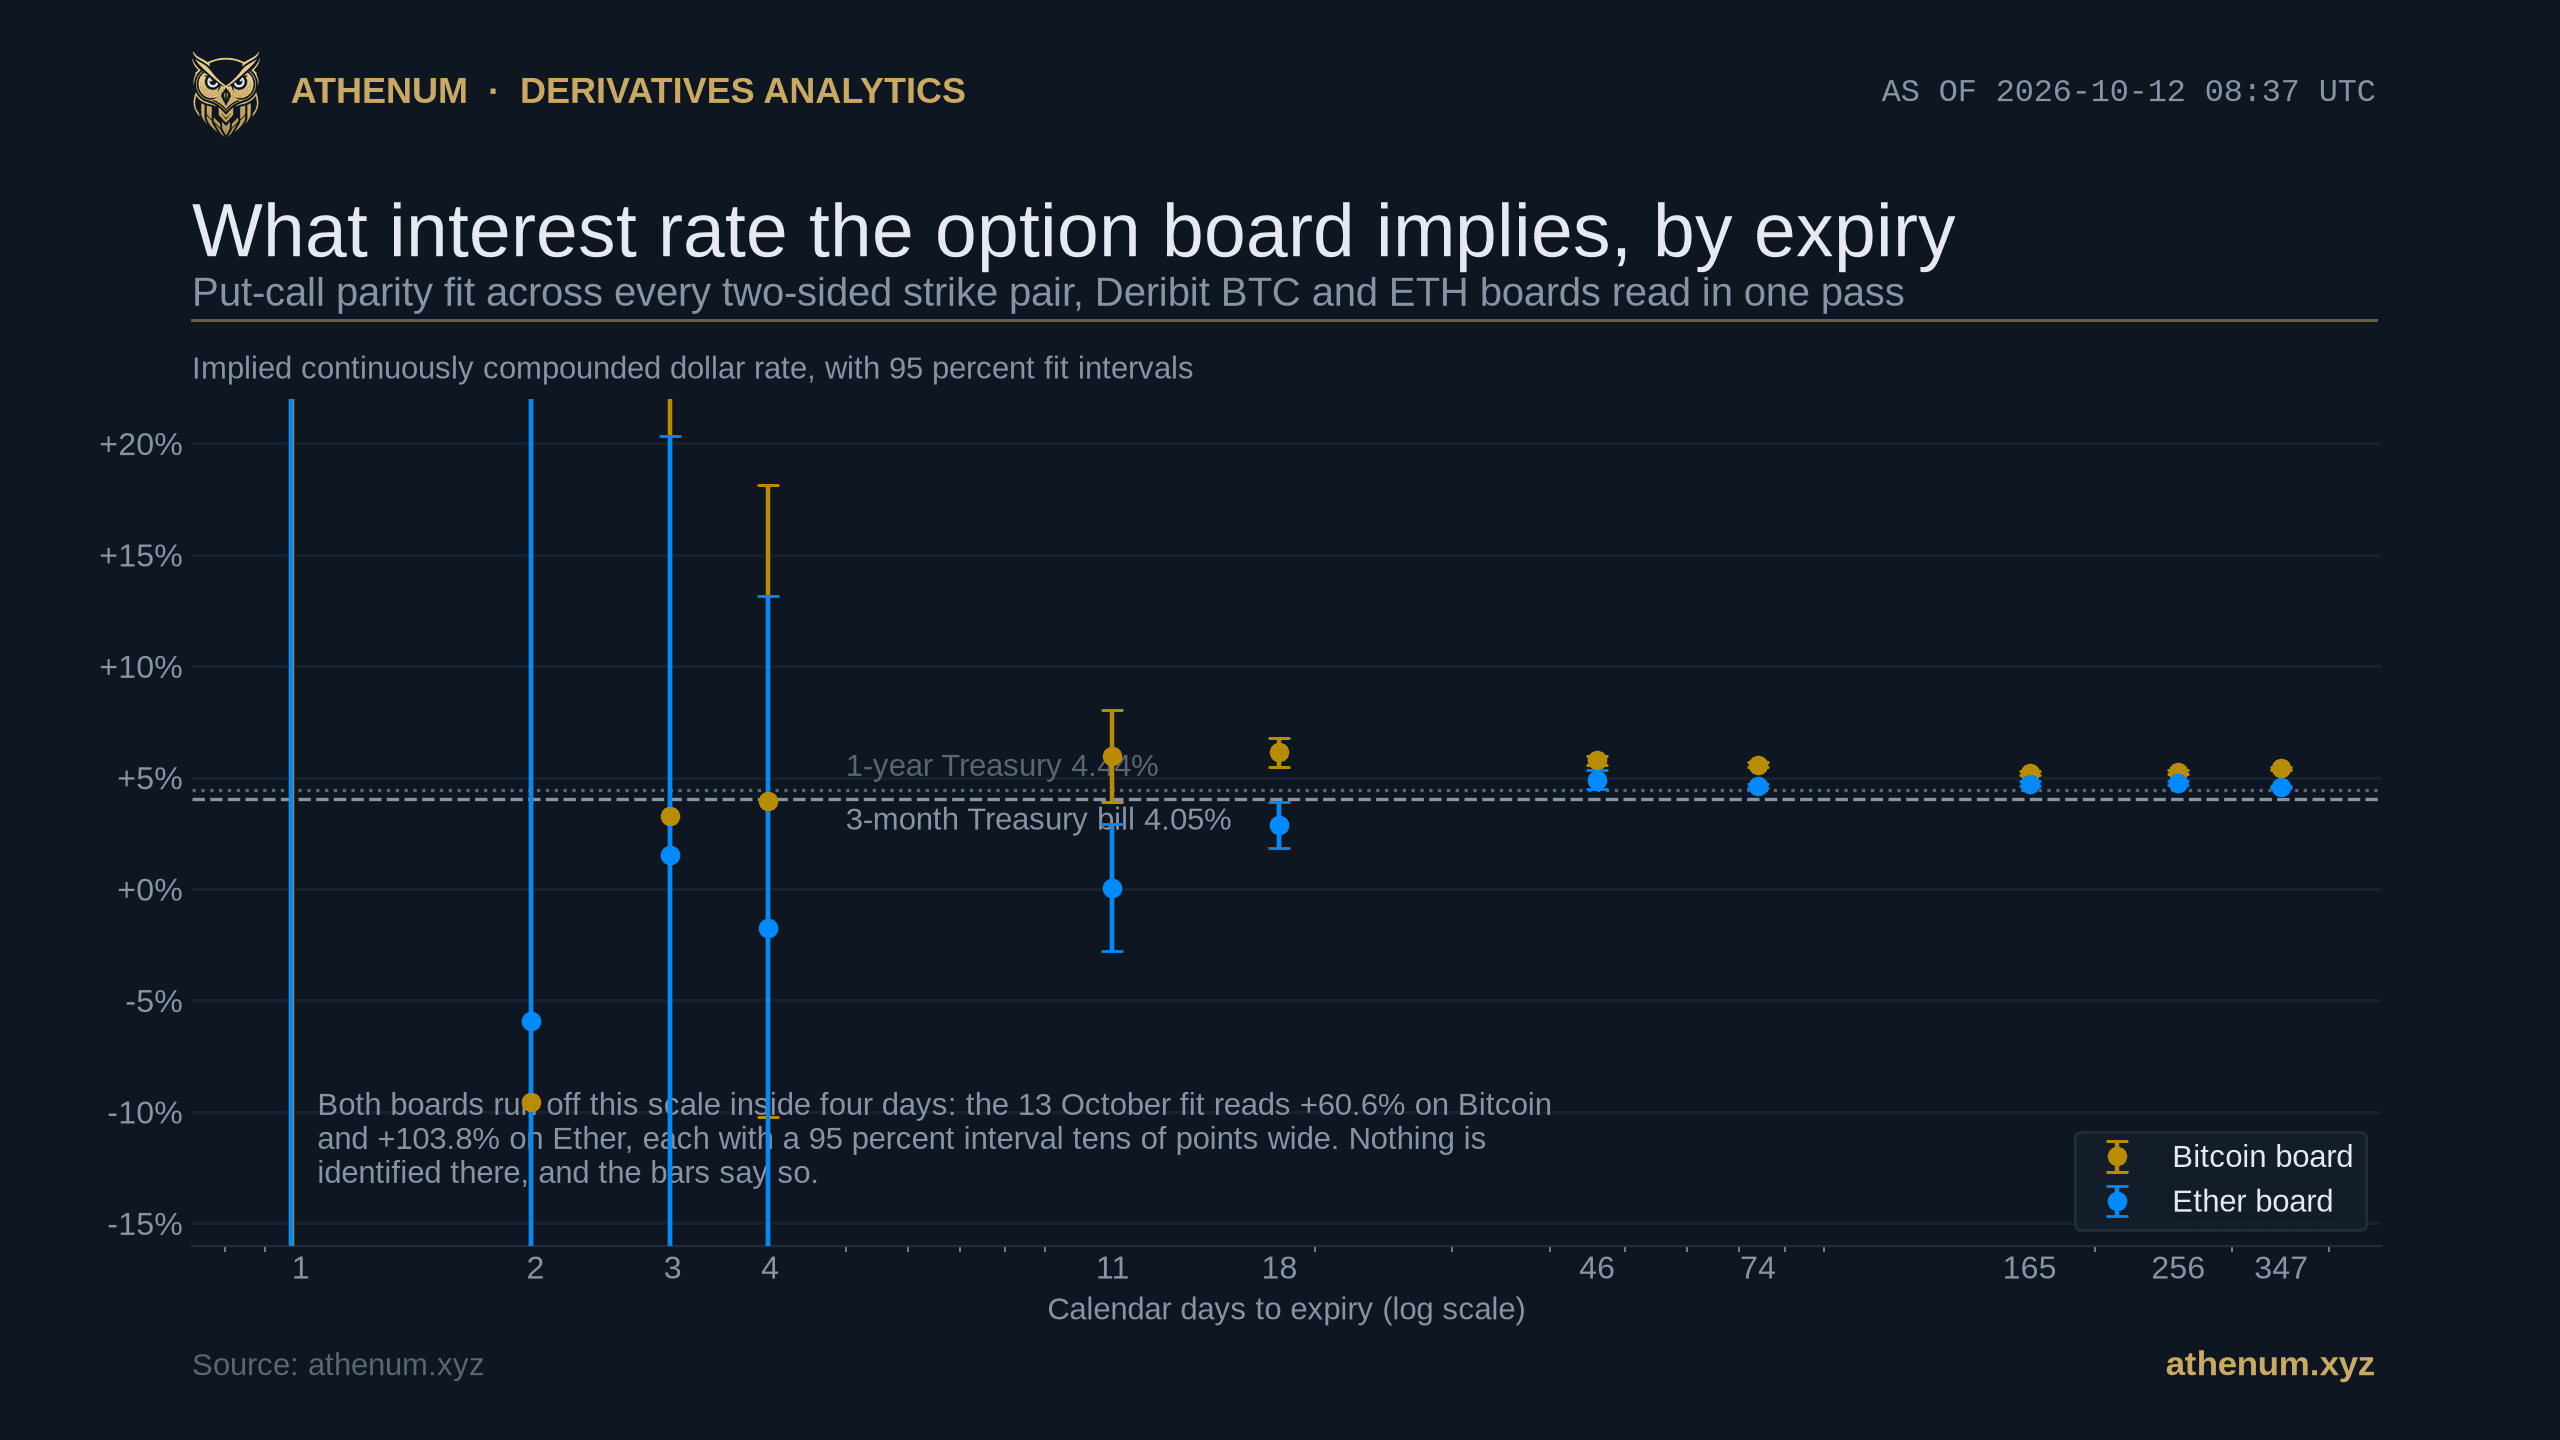
On 2026-10-12 at 08:37:43 UTC, between 5.2 and 6.1 percent, depending on how far out you look, and the estimate is far tighter than most market numbers ever get. The full Deribit Bitcoin board carried 884 listed contracts at that second, of which 399 call and put pairs shared a strike and had a live bid and a live ask on all four legs. Fitting those pairs expiry by expiry gives:
- 5.99 percent at 11 days (23 October, 23 pairs, 95 percent interval plus or minus 2.07 points), 6.13 percent at 18 days (30 October, 45 pairs, plus or minus 0.64). - 5.78 percent at 46 days (27 November, 48 pairs, plus or minus 0.20) and 5.59 percent at 74 days (25 December, 58 pairs, plus or minus 0.11). - 5.22 percent at 165 days, 5.25 percent at 256 days and 5.42 percent at 347 days (26 March, 25 June and 24 September 2027, 52, 54 and 42 pairs, intervals of 0.09, 0.08 and 0.06 points). - Nothing at all inside four days. The 13 October fit reads plus 60.57 percent and the 14 October fit minus 9.53 percent, with 95 percent intervals of plus or minus 138 and 59 points. Those are not rates. They are the same few dollars of quoting noise divided by a horizon of one or two days.
Against the published dollar curve on the same days, the shape is familiar and the level is not: the DTB3 3-month bill printed 4.05 percent and the DGS1 1-year Treasury 4.44 percent in their 2026-10-08 readings, the most recent the Federal Reserve Bank of St Louis has published as of this morning, 2026-10-12. Those two are quoted on conventions of their own, a discount basis bill and a par yield, so converting both to the continuously compounded basis this post uses puts the bill at 4.13 percent and the 1-year at 4.39 percent. On that like for like footing the Bitcoin board sits 1.46 points above the bill at 74 days and 1.03 points above the 1-year at 347 days.
None of the framing here is new, and pretending otherwise would be dishonest. Brenner and Galai set out the extraction of an implied rate by rearranging put-call parity in 1986, Ronn and Ronn tested the box spread conditions on CBOE options in the Review of Financial Studies in 1989, where American exercise buys bounds rather than a point rate, and van Binsbergen, Diamond and Grotteria rebuilt the US risk free curve from European S&P 500 box spreads in the Journal of Financial Economics in 2022. For crypto specifically, Bergault, Bieber, Gueant and Zhang posted *Cryptocurrencies and Interest Rates: Inferring Yield Curves in a Bondless Market* (arXiv 2509.03964, September 2025, revised December 2025), which builds exactly this curve from Deribit option data because the asset class has no bonds to build it from, and Alexander, Chen, Deng and Wang set out the fiat free put-call parity and the box spread test for the same inverse board in *Arbitrage opportunities and efficiency tests in crypto derivatives* (Journal of Financial Markets, 2024). The Bitcoin against Ether gap that this post spends a section on belongs to that literature too: Bergault and co-authors report an average spread of about 1 point between the dollar rates inferred from the two boards over 2022 to 2024, decaying with tenor, which is the shape measured again here in one pass. What follows is a dated live replication with error bars, not a new method and not a new finding.
How do you read a rate off a pair of option quotes?
By running a line through the board, because put-call parity is a straight line and both of its coefficients are things you want. For European options on the same underlying and expiry, the call price minus the put price at strike K equals the discount factor times the forward minus K. Deribit quotes its Bitcoin options in BTC, so each premium becomes dollars by multiplying by the index at the same second.
1. Pair the board. Keep only strikes where a call and a put both have a live bid and a live ask. On 2026-10-12 that was 399 pairs on Bitcoin and 351 on Ether, out of 884 and 750 listed contracts. 2. Build the y axis. For each pair, take the call mid minus the put mid, in coin, and multiply by the index, which `public/get_index_price?index_name=btc_usd` returned as $83,621.84 for Bitcoin at 08:37:43 UTC. 3. Fit the line. Regress that difference on the strike. The slope is minus the discount factor and the intercept is the discount factor times the forward, so the forward is the intercept divided by minus the slope. 4. Turn the discount factor into a rate. The continuously compounded rate is minus the natural log of the discount factor divided by the year fraction to expiry. The standard error of the slope carries straight through, which is where every interval quoted above comes from. 5. Feed it back into a pricing model. The rate you just recovered is the `r` input every option pricing model wants, including the free Athenum Black Scholes calculator; it prices from spot rather than from a forward, and a rate is what carries one to the other: on the 347 day expiry the same fit returns a forward of $87,964.66 against the $83,621.84 index, a continuously compounded premium of 5.33 percent, which the simple convention would annualise as 5.46 percent, next to the 5.42 percent the slope returns as the discount rate. Slope and intercept are separately estimated, so those two need not agree, and the 0.10 point wedge between them is the coin's own implied lease rate, which the Ether section below measures across expiries and finds indistinguishable from zero. That is the number to put in the calculator's rate field: 5.42 percent, not the zero a crypto option table will default to. 6. Check it against the version with no forward in it. Take any two strikes and difference their two parity relations. The forward cancels and what remains is a box spread whose price is a discount factor. On a coin margined board the index does not cancel with it, because the premium is paid in coin, so this version drops one input rather than two.

Why the fit is believable: on the 25 December expiry all 58 residuals sit inside half the combined quoted bid to ask spread of the pair that produced them. The board is internally consistent to inside its own trading costs, so the line is reading a price, not a rounding artefact.
Is the number identified, or is it just noise with a decimal point?
Both, and the horizon decides which. The 58 two-sided strikes on the 25 December expiry make 1,653 pairs, of which 1,570 sit at least 5 percent of the index apart, and each of those can be priced as a separate box spread, which gives a distribution rather than a point: the median box on that expiry implies 5.54 percent, with an interquartile range of 5.25 to 5.91 percent, against 5.59 percent for the regression that uses all of them at once. The two are not independent, and saying so matters: the least squares slope is exactly the squared strike distance weighted mean of those same pairwise boxes, so the 0.05 points between the median and the fit is a statement about the skew of one distribution, not a second opinion. What the distribution does buy is an honest picture of dispersion, which is the next chart.

The funnel is the finding. Every box is the same arithmetic on the same board at the same second, and the only thing that changes left to right is how many days the noise is divided by. A one day expiry gives 16 usable pairs whose middle half alone spans 173 points, too tall for this scale and labelled as such; the December expiry gives 1,570 spanning two thirds of a point.
Run the same fit on Deribit's own published mark prices instead of the live quotes and the rate looks almost identical, 5.5885 percent at 74 days, but it is not a second measurement. Deribit publishes `interest_rate` as exactly 0.0 on all 884 Bitcoin option instruments and marks its options off the dated future for the same expiry, so the mark derived rate is arithmetically the annualised premium of that future over the index: the natural log of the 25 December future's $84,573.75 mid over the $83,621.84 index, divided by the year fraction, is 5.5851 percent. The two agree to 0.0034 points because they are the same number wearing different clothes. Anyone reading a rate off option marks is reading the futures basis back to themselves.
Does the option board agree with the futures board?
To within about five basis points of the index, which sounds like a control and is closer to an identity, so it is worth being blunt about what it is not. Comparing each parity forward with the mid of the Deribit dated future on the same expiry, the median absolute difference across the 11 expiries is $8.18 and the largest is $44.55 on 25 June 2027, which is 5.3 basis points of the index. The median combined quoted spread of the strike pairs behind each fit runs from $359.57 to $940.75, so every one of those differences is deep inside the cost of trading the pair that produced it. That agreement is close to automatic: the parity forward is the intercept divided by minus the slope, which reproduces the future whenever the board is quoted consistently against its own future, so the dollars above measure quoting noise rather than confirming a level. The level itself is just as unoriginal, and this is the part a reader should take away: the 74 day quote fit of 5.5851 percent and the annualised premium of the same expiry's future, 5.5851 percent, agree to four decimal places. Across the seven identified expiries the quote fit sits a median of 0.13 points from the futures basis, at most 0.59 points, on the 11 day contract. The option board does not hold an independent opinion about the level. What it adds is a fit over dozens of strikes instead of one quote, and an error bar. The Athenum post on the Bitcoin futures basis term structure measured the same curve from the other side on 2026-08-19, with the convention basis equals mark over index minus one, scaled by 365 over days; on the 25 December expiry today that convention gives 5.6168 percent off the future's mid and 5.6249 percent off its mark, against 5.5851 percent continuously compounded, and the difference is compounding and quote choice, not disagreement. The cash and carry explainer is the trade that lives in this gap.
Why does Ether imply a lower rate than Bitcoin 91 seconds later?
Because what the fit recovers is not a risk free rate, and this is the part of the post that takes the headline apart. A dollar borrowed against Bitcoin collateral and a dollar borrowed against Ether collateral are the same dollar, so two boards on the same venue, in the same collateral regime, read 91 seconds apart, should not disagree. They do, at every expiry where both are identified on 2026-10-12:
Expiry | Days | Bitcoin board | Ether board | Gap |
|---|---|---|---|---|
23 October 2026 | 11 | 5.99% +- 2.07 | 0.06% +- 2.84 | 5.93 points |
30 October 2026 | 18 | 6.13% +- 0.64 | 2.87% +- 1.04 | 3.26 points |
27 November 2026 | 46 | 5.78% +- 0.20 | 4.91% +- 0.43 | 0.87 points |
25 December 2026 | 74 | 5.59% +- 0.11 | 4.61% +- 0.10 | 0.97 points |
26 March 2027 | 165 | 5.22% +- 0.09 | 4.74% +- 0.11 | 0.49 points |
25 June 2027 | 256 | 5.25% +- 0.08 | 4.77% +- 0.08 | 0.49 points |
24 September 2027 | 347 | 5.42% +- 0.06 | 4.57% +- 0.04 | 0.85 points |
Every gap in that last column is the difference of the two unrounded fits, so three of them sit 0.01 away from what you get by subtracting the rounded cells beside them. At the four longest expiries the intervals do not come close to overlapping, so the disagreement is not sampling noise. The tempting resolution is that a coin margined board mixes the dollar rate with the cost of borrowing the coin, and it is wrong. Difference the two parity relations and the coin leg cancels: the slope is the dollar discount factor and nothing else. The coin rate lives in the intercept instead, and it can be read off directly, because the intercept divided by the index is the coin's own zero coupon price. Measured on this board at this second, that implies a Bitcoin lending rate of minus 0.06 percent at 74 days and minus 0.16 to plus 0.10 percent across the four longest expiries, which is indistinguishable from zero. So the board prices coin lending at nothing, and the one point between Bitcoin and Ether is not a lease rate.
What is left is a disagreement about dollars between two boards in the same collateral regime on the same venue, which is exactly what Bergault and co-authors documented over three years and did not explain. The honest label for the 5.59 percent is therefore the rate at which Deribit's Bitcoin quotes discount a dollar to 25 December, a platform rate rather than a risk free one, and the Ether board's 4.61 percent is the same thing read on a different board, with no accepted account of why they differ.
What do perpetuals say about the same rate today?
Something much louder and much less usable, and this is where our own cross venue feed earns its keep. Reading Athenum's normalized derivatives feed at the 08:00 UTC bar on 2026-10-12 and annualising each venue's funding at that venue's own interval, which is 8 hours on Binance, Bybit, OKX, Bitget and Deribit and 1 hour on Hyperliquid, the same cost of carry reads, in simple annualisation rather than the continuous compounding used for the option curve, a convention difference of under 0.001 points here because a funding rate compounds 1,095 or 8,760 times a year rather than once:

Binance, Bybit, OKX, Bitget, Deribit and Hyperliquid, one hour, one asset: the perpetual answer to the same question spans 7.89 points. The whiskers are the interquartile range of the past 168 hourly readings, and on Bitget and Hyperliquid they run to 10.95 percent, which is not a market price but the 0.01 percent per 8 hours interest component written into the funding formula.
Binance read plus 2.55 percent, Bitget plus 2.83, OKX plus 3.07, Bybit plus 4.47, Deribit plus 7.99 and Hyperliquid plus 10.44, a spread of 7.89 points between the cheapest and the dearest venue at the same hour. Over the closed week before that bar, 2026-10-05 09:00 UTC to 2026-10-12 08:00 UTC, the per venue means span 0.48 percent on Binance to 6.39 percent on Bitget, still 5.9 points wide. Compare that with plus or minus 0.11 points on the option board's 74 day reading, or plus or minus 0.21 if you recompute it with a heteroskedasticity robust estimator, which is the honest version because the quoted spread widens with strike, and the ranking is still not close: if you want the market's price of a dollar, the option board tells you, and funding does not.
Part of the perpetual spread is not a price at all. The funding formula on most venues adds a fixed interest component of 0.01 percent per 8 hours, which annualises to 10.95 percent, and the premium against it is what actually floats. In the 168 hour window above, Hyperliquid printed within 0.22 points of 10.95 in 77 of those hours, Bitget in 54 and Bybit in 4, so a reader annualising those prints is partly reading a constant somebody hardcoded, not today's cost of money. Deribit is the exception that proves it: its funding is pure clamped premium with no interest component, which is why its series touches exactly zero in this window and never pins at 10.95. Our explainers on how funding rates are calculated and on the funding interval being a property of the symbol rather than the exchange cover why the annualisation has to be done venue by venue, and the free funding rate calculator does that arithmetic for a position you actually hold, and the funding arbitrage calculator prices the carry trade that this whole post is measuring the rate of.
What this does not show
It is one instant. Every option figure here comes from a single pass over the Deribit boards between 08:37:43 and 08:39:14 UTC on 2026-10-12. Rates move, and the front of this curve moves violently, so nothing above should be quoted back as a current number next week.
It is one venue. Deribit is the crypto native options venue whose entire board is readable without a key, which is why it is the board measured here, and a rate implied by one venue's quotes embeds that venue's own collateral and credit conditions. The box spread literature makes the same point about equity markets, where the implied rate sits above Treasuries for exactly that reason.
It is mid quotes, not trades. A mid is where the board says it would deal, not where it dealt, and on the 25 December expiry the median combined spread of a pair is $459.92 wide. The residual chart is the defence: every pair lands inside half that spread, so the line is well inside the noise it is fitted through, but a rate read off mids is still a rate read off intentions.
The Bitcoin and Ether gap is measured, not explained. This post shows the two boards disagreeing by half a point to a point from 46 days out, and it rules one explanation out rather than in: the disagreement is not a coin lease rate, because the same fits price coin lending at essentially zero. What is left is a gap in the dollar rate itself between two boards in the same collateral regime, which the published work reports and does not explain either, and nothing in a single snapshot of quotes can settle it.
Every option number above came from Deribit endpoints that asked for no key, and the Treasury series are public FRED series, so the whole measurement can be rebuilt from scratch in an afternoon. The cross venue perpetual readings come from Athenum's own normalized feed reading Binance, Bybit, OKX, Bitget, Hyperliquid and Deribit onto one clock, and the 37 free tools beside it, 35 of them calculators, ask for no account, take no email address and cap nobody's usage. The terminal behind those cross exchange readings opens on a free 7 day Pro+ trial at app.athenum.xyz, which takes no card.
One terminal. All the data.
Liquidations, orderbook depth, whale walls & open interest from 4 exchanges, all real-time, in one place.
No credit card required

Athenum Analytics
Athenum Analytics is our three-person editorial team covering crypto derivatives, market data and macroeconomic context.