Table of Contents9 sections
- What does a negative funding rate actually mean?
- How often does Bitcoin funding actually go negative?
- Do the exchanges ever agree that funding is negative?
- How deep do the negative settlements go?
- Why do two exchanges disagree about the sign at the same moment?
- Which pairs of exchanges disagree most?
- Does a second sampling see the same ranking?
- How can you check this yourself?
- What this does not show
Practise with worked lessons
- Distinguish crowded positioning from a squeeze
Use funding and open interest as context for crowded positioning. Require an adverse price move and forced-flow evidence before calling it a squeeze.
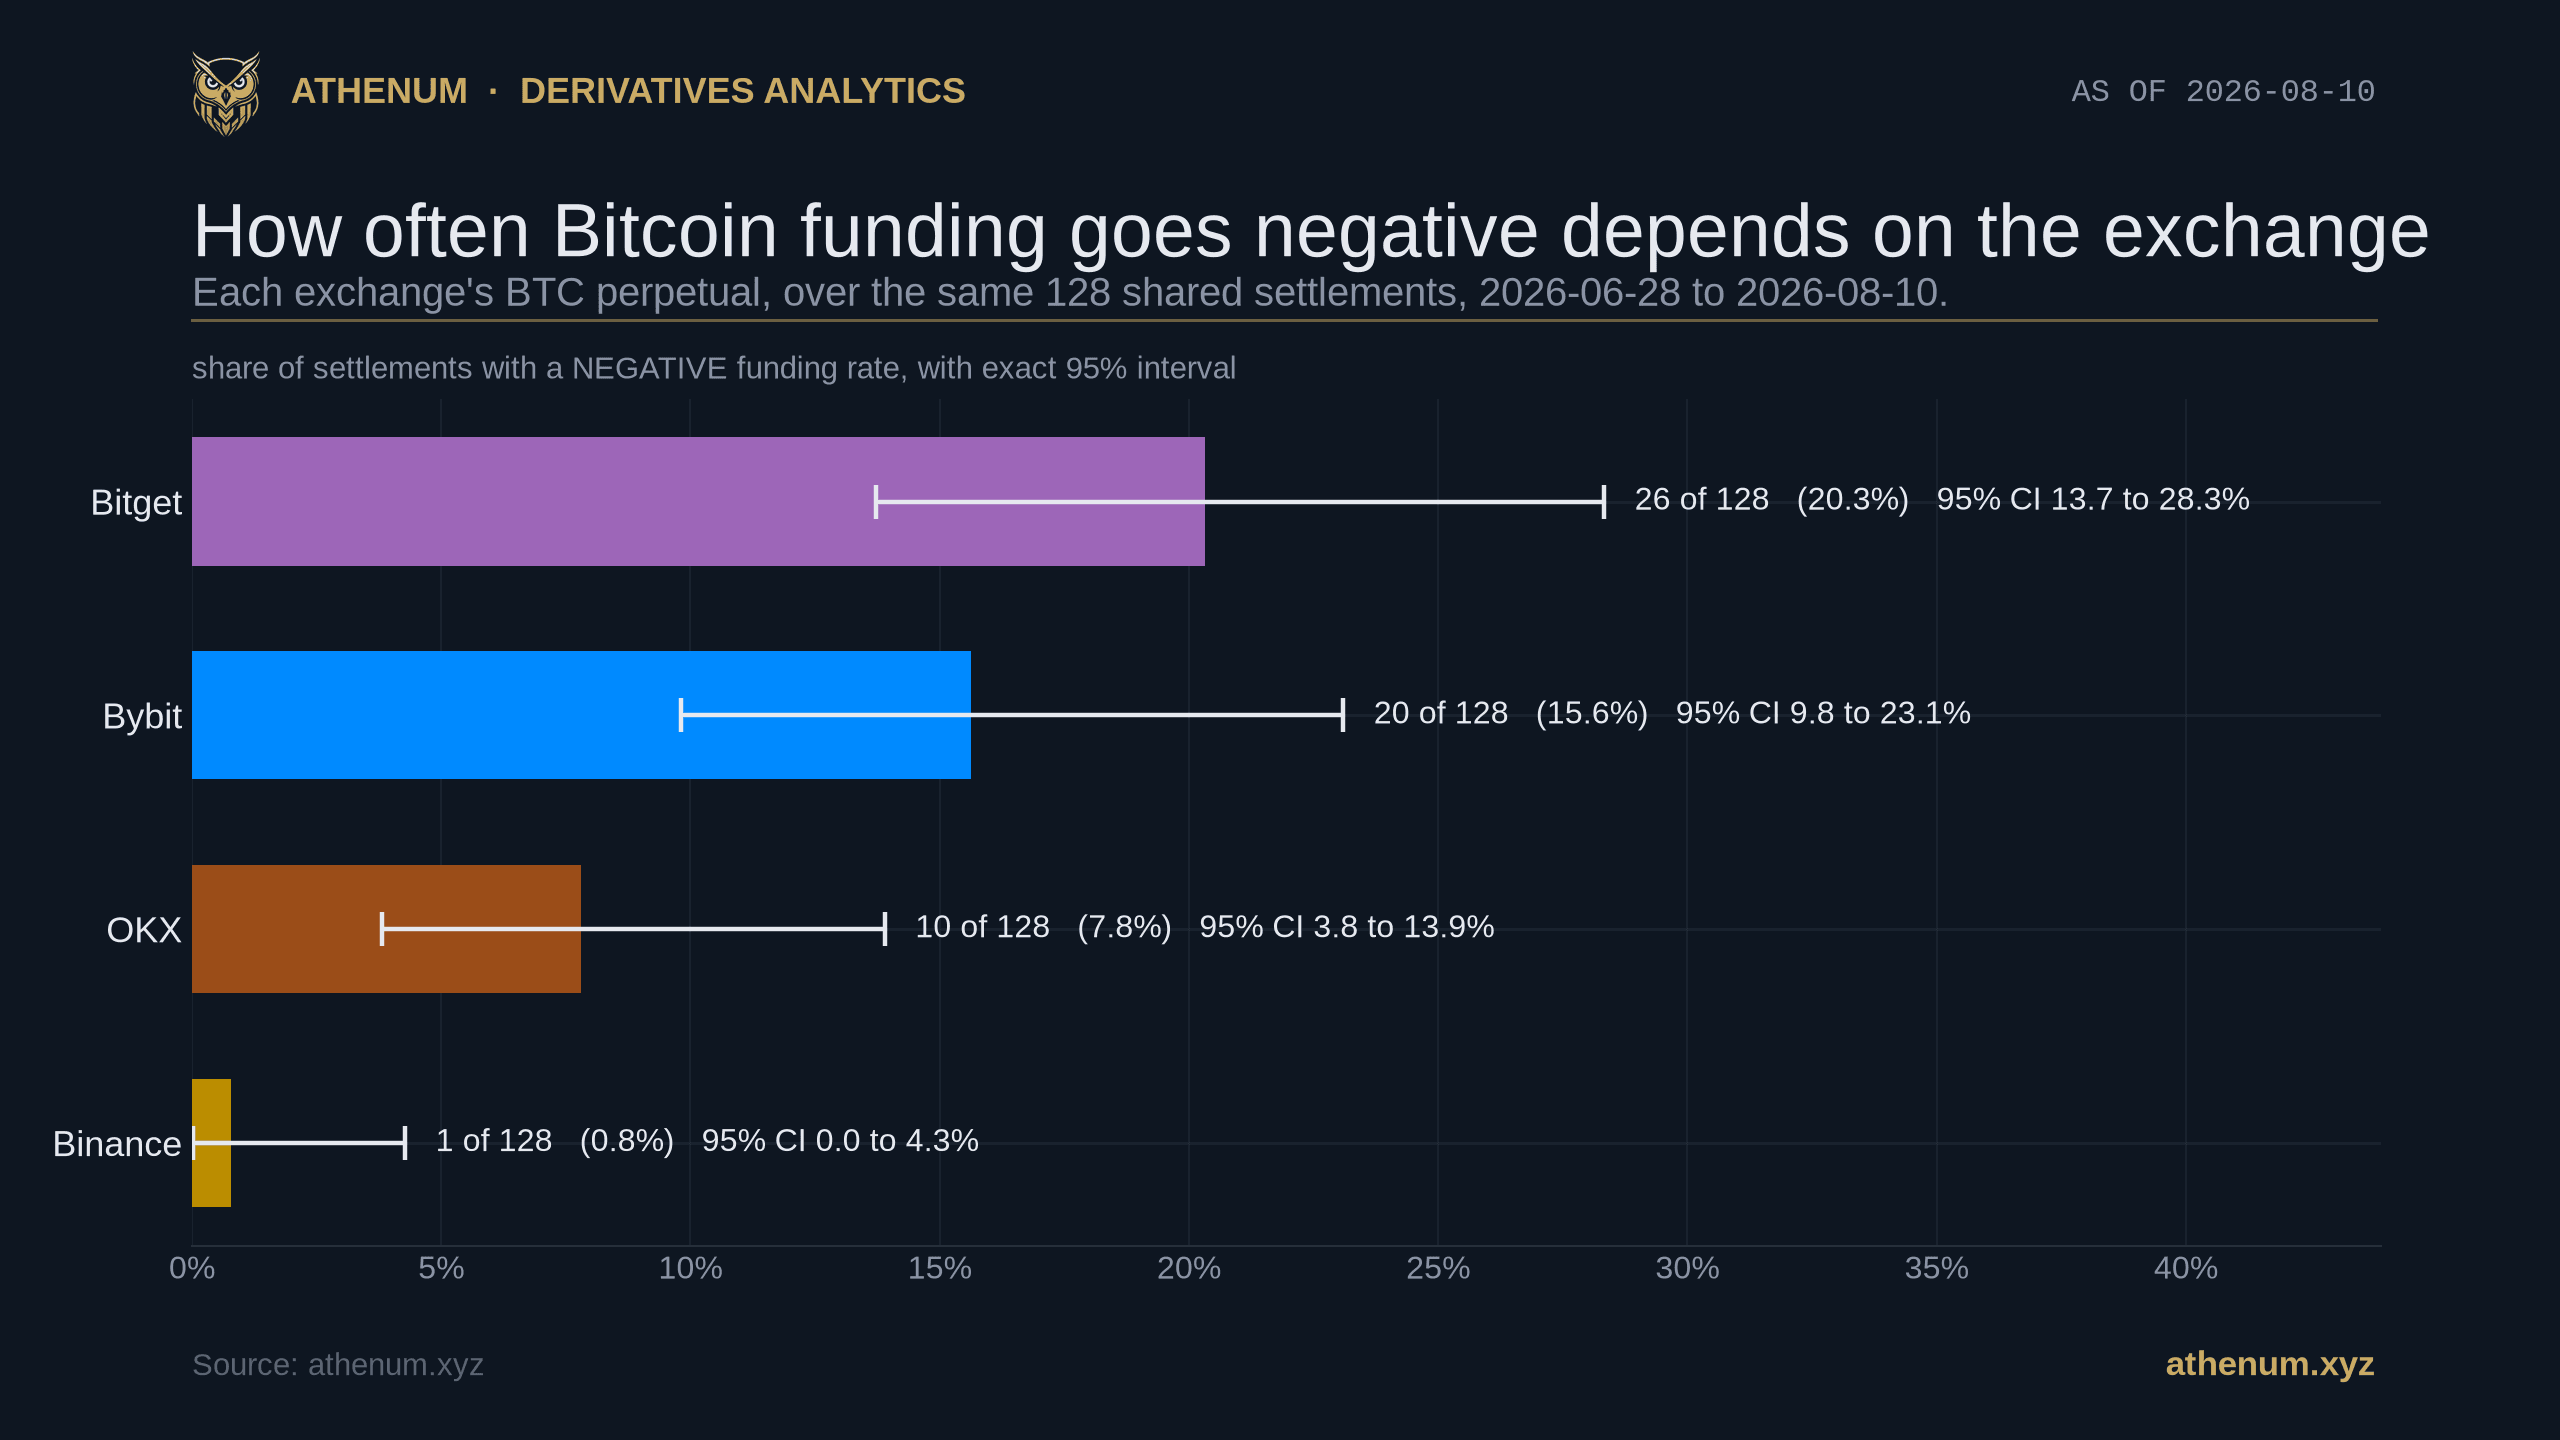
TLDR. A negative funding rate is the most quoted sentiment signal in crypto derivatives, and it is almost always quoted from one exchange as though it described the whole market. How often you see one depends enormously on which exchange you happen to read. We took the published funding history of the BTC perpetual on Binance, Bybit, OKX and Bitget over the 128 settlements they share, from 2026-06-28 16:00 UTC to 2026-08-10 00:00 UTC, and counted the sign at every one. Binance printed a negative rate at 1 of the 128. Bitget printed one at 26 of the 128. That gap is large and statistically solid, at a Fisher exact p below 0.0001, though the Binance end of it rests on a single event. At least one of the four was negative at 47 of the 128 settlements, and all four together at none of them, which turns out to be exactly what four unrelated venues would also produce and is therefore not the finding. The finding is the frequency gap, and its practical consequence is that "funding went negative" identifies a venue before it describes Bitcoin.
What does a negative funding rate actually mean?
It means the perpetual is trading below the spot index it tracks, so the mechanism that pins the two together pays long positions and charges short ones. That is the direction every one of these venues documents: when the rate is negative, shorts pay longs. All four venues in this study settled that payment every eight hours across this window, at 00:00, 08:00 and 16:00 UTC, and publish the rate they used. Eight hours is a per-contract default rather than a fixed property of an exchange, and Binance, Bybit and OKX all shorten a symbol's interval automatically when funding keeps reaching its cap, so the interval is worth reading per symbol rather than assuming. For Bitcoin, on these four, it was eight hours throughout.
The number is small by construction: it is a fee on notional, not a price move. The reason traders watch it anyway is that the sign is read as positioning. Positive funding is taken to mean longs are crowded and paying to stay. Negative funding is taken to mean the opposite, and it gets reported as a market-wide capitulation or a squeeze setup.
The problem is in the last three words. Each of the four computes funding from its own order book against its own index price, so the rate is a property of that venue's book. The fixed interest-rate component is not what separates them: all four apply 0.01% per eight hours on this contract. What differs is the book underneath, and the cap each venue clamps the result to, which every one of them publishes on its own endpoint: 0.30% on Binance and Bitget, 0.375% on OKX and 0.50% on Bybit.
How often does Bitcoin funding actually go negative?
Far less often than the coverage implies, and by very different amounts depending on which venue you read. Over the 128 settlements the four venues share, Binance's BTC perpetual settled negative exactly once, on 2026-07-23 00:00 UTC, at 0.0003% below zero. Bitget settled negative 26 times, twenty six times as often, on the same asset over the same window. Bybit and OKX sit between them. Every one of those figures comes from each exchange's own public funding history, not from an aggregate, so any reader can pull the same rows.
Exchange | Negative settlements | Share of the 128 | Exact 95% interval | Deepest negative |
|---|---|---|---|---|
Binance | 1 | 0.8% | 0.0% to 4.3% | 0.0003% |
OKX | 10 | 7.8% | 3.8% to 13.9% | 0.0039% |
Bybit | 20 | 15.6% | 9.8% to 23.1% | 0.0047% |
Bitget | 26 | 20.3% | 13.7% to 28.3% | 0.0127% |
Those intervals are the honest limit on the ranking, and they matter because the Binance figure rests on a single event: had Binance printed two negatives instead of one, the headline ratio would halve. Testing the counts directly against each other, four of the six pairwise gaps survive and two do not. Binance separates from all three of the others, with a Fisher exact p of 0.010 against OKX and below 0.0001 against both Bybit and Bitget, and OKX separates from Bitget at p = 0.006. Bybit against Bitget at p = 0.42, and OKX against Bybit at p = 0.079, are simply not resolved by six weeks of data. So the top and the bottom of this ranking are real and the middle of it should be read as unordered. Those are six comparisons on one dataset, so they deserve a multiplicity correction: at a conservative Bonferroni threshold of 0.05 divided by six, or 0.008, the Binance against OKX gap at p = 0.010 no longer clears the bar, while Binance against Bybit, Binance against Bitget and OKX against Bitget all clear it comfortably.
One more objection cuts deeper, and it is the one we would raise ourselves. That test treats the 128 settlements as independent trials, and they are not: negative settlements arrive in runs. The lag one autocorrelation of the negative indicator is +0.23 on Bybit and +0.13 on Bitget. Resampling in blocks that preserve those runs inflates the variance by about 70% on Bybit and roughly a fifth to a third on OKX and Bitget, which is the same as saying Bybit's 128 settlements carry about 75 settlements' worth of independent information. So the intervals in the table above are optimistic for those three venues rather than being the last word, and the OKX against Bitget gap, which cleared the corrected bar at p = 0.006 by a narrow margin, is close enough to it that we would not lean on it. What this cannot touch is Binance: with a single negative settlement there is nothing to cluster, its variance inflation measures at 1.0, and both Binance gaps survive every version of the test we ran. The intervals drawn on the chart above overlap for exactly two of the pairs the direct test still separates, Binance against OKX and OKX against Bitget, which is expected rather than a contradiction: comparing two intervals by eye is a more conservative check than testing the two counts against each other.
The ordering is also not an artefact of where we cut the window. Measured a completely different way, hour by hour rather than settlement by settlement, it reproduces in the same order, which is the check further down this post.
Do the exchanges ever agree that funding is negative?
At these settlements, rarely, and the honest reading of that is duller than it first looks. Of the 128 shared settlements, 81 had every venue positive, 37 had exactly one venue negative, and 10 had exactly two. Three of four and four of four occurred zero times.
It is tempting to present that as evidence that negative funding is a purely venue-local event. It is not, and the arithmetic says so plainly. Given how rarely each venue goes negative on its own, four unrelated venues would produce a unanimous settlement with probability 0.0000194, which is 0.0025 settlements expected in a window of this size. The chance of seeing even one is about 0.25%. Observing zero is therefore exactly what independence predicts, and it cannot distinguish a venue-local story from any other.

Unanimity, counted directly, against what four independent venues would produce. The empty three and four columns are not a discovery: independence predicts 0.37 and 0.0025 settlements there. The column that departs from the baseline is two-of-four, which is over-populated, so if anything these venues co-move slightly.
Look at the column that does depart from the baseline and it runs against the venue-local story rather than for it: two of four negative happened 10 times where independence predicts 7.0. If these venues differ at all from unrelated, they lean very slightly towards going negative together, not apart. That gap is not statistically significant either, so the fair summary is that we cannot distinguish these venues' negative episodes from independent, and we certainly cannot show they are more independent than chance.
The same caution applies to a line we nearly printed as a punchline. All 26 of Bitget's negative settlements coincided with a positive Binance settlement, which sounds decisive until you notice that with Binance negative at only 1 of 128, the chance of no overlap at all is about 80%. It is an unsurprising observation, not evidence.
There is also a real counter-example inside our own data, and the settlement grid simply does not sample it. Athenum's hourly panel of the same four venues catches two hours, both on 2026-08-03, when all four were below zero at once, and in the second of them, 20:00 UTC, Hyperliquid was negative too, making it five. Both recovered before the next eight hour settlement printed. So the accurate statement is not that Bitcoin funding was never negative everywhere. It is that when it happened it was too brief to settle, which is a claim about duration, and it is only visible if you sample more often than the settlements do.
How deep do the negative settlements go?
Shallow, and this is the part that cuts against a dramatic reading, so it belongs here rather than in a footnote. Across all four venues there were 57 negative settlements in the window. Their median depth was 0.0019%, and only 3 of the 57 were deeper than 0.01%. All three of those were Bitget.

Every negative settlement in the window, drawn individually so the spread is visible rather than summarised away. Only 3 of the 57 negatives are deeper than 0.01%, all on Bitget, and the deepest of all is 0.0127%.
So a reader who treats a negative print as evidence of a violent unwind is usually reading a fee of about two thousandths of a percent per eight hours. Annualised simply, at three settlements a day and without compounding, that median negative is about 2.0% a year: real money on a large book and nothing like a capitulation. The deepest single print in the whole window, Bitget on 2026-08-06 00:00 UTC at 0.0127%, is about 13.9% annualised on the same simple basis, and even then Binance and OKX were both positive at that same settlement.
One feature of these series is worth flagging because it looks alarming and is not. Across all 512 venue-settlement observations, not one printed above 0.01% per eight hours, and 54 of the 512 landed on exactly that value. That 0.01% is the same fixed interest-rate component named earlier, so a pile-up there is the formula showing through rather than a market fact, and it sits far below the caps these venues publish. The important part is that the ceiling is on the positive side only, so it cannot flatter any count in this post. The negative side is demonstrably not clipped: three settlements print past 0.01% below zero, the deepest at 0.0127%, and the hourly panel reaches 0.0157% below zero on Bitget. Every figure here is a count of negatives, and none of them touches the ceiling.
Why do two exchanges disagree about the sign at the same moment?
Because they are measuring different books. Funding is built from the premium of a venue's own perpetual over its own index, blended with an interest-rate component, and the premium half is venue-specific. A perpetual that sits a hair under its index on one venue and a hair over it on another produces opposite signs from the same market, and no arbitrage forces those two to converge exactly, because closing the gap means holding offsetting positions on two exchanges with separate margin and separate liquidation risk.

The four series at every shared settlement. Nothing prints above the dashed 0.01% line in six weeks on any venue, while below the zero line the venues are clearly on their own schedules.
The widest single moment in the window was 2026-08-06 00:00 UTC, where OKX settled at plus 0.0068% and Bitget at minus 0.0127%. That is a spread of 0.0195 percentage points between two venues quoting the same asset at the same instant, with the two of them on opposite sides of zero. If you have ever wondered why one dashboard says the market is short-crowded while another says the opposite, this is a large part of the answer. It is also why the earlier Athenum write-up on funding intervals matters before any cross-venue comparison: the raw rates are quoted per settlement interval, and a venue that pays hourly is not comparable to one that pays every eight hours until you put them on the same basis.
That correction is not cosmetic. Across the same 998 hours, Hyperliquid's published number is the smallest of the five venues in 487 hours, which is 48.8% of them, largely because it is one eighth the size by construction. Once every rate is placed on a common eight hour basis it is the smallest in only 74 hours, or 7.4%. Reading the published numbers side by side therefore names the wrong cheapest venue in 433 of 998 hours, 43.4% of the time, without a single bad data point anywhere in it.
Which pairs of exchanges disagree most?
The pair you pick changes the answer by nearly four times. Bybit against Bitget disagreed about the sign at 40 of the 128 settlements, or 31.2%. Binance against OKX disagreed at 11, or 8.6%. Every pair involving Bitget sits at the top of the table, which is consistent with it being the venue that goes negative most often rather than a separate effect.

All six pairs, ranked. The spread between the most and least contradictory pair is 40 settlements against 11, so which two venues a dashboard happens to compare decides how disagreeable funding looks.
Does a second sampling see the same ranking?
Yes, and this is the check that decides whether the ranking is a data artefact. The counts so far come from each exchange's own published settlement history. Athenum also keeps an hourly cross-venue panel of the same market, which reads the rate as it stands in each hour rather than at settlement. That is a different sampling of the same published fields rather than a truly independent measurement, and it is worth being precise about that, but it is sensitive to different things and so it does test whether the ranking is an artefact of the settlement grid. Over 998 aligned completed hours to 2026-08-10 07:00 UTC it puts the venues in the identical order: Binance negative in 2.6% of hours, OKX in 9.0%, Bybit in 19.0% and Bitget in 26.1%. Re-pulled on 2026-08-11 that panel rolls rather than grows, dropping its oldest 24 hours and picking up 24 new ones, and it returns the same order: Binance 2.3%, OKX 9.0%, Bybit 18.7% and Bitget 26.0%. That is a weak check rather than a replication, because 975 of the 999 completed hours are the same hours, and it is worth saying so.

The same question asked two ways. Left bar of each pair is the venue's own settled history, right bar is Athenum's hourly panel. The levels differ because an hourly sample catches dips inside a window that ultimately settles positive; the ordering is identical.
The two series differ in level and that difference is expected rather than awkward: an hourly reading catches a rate that dips below zero mid-window and recovers before it settles, so it counts moments the settled history never records. That is the same mechanism that produced the 2026-08-03 counter-example above. The one venue where the two nearly coincide is the one that pays every hour, Hyperliquid, at 6.9% of hours against 6.4% of its own 1,026 published settlements. That is the control working. Hyperliquid is also the clearest case for a common basis: it computes an eight hour rate the same way the others do and then pays one eighth of it each hour, and its index is an explicit weighted median of several exchanges' spot prices rather than its own book alone.
Two things about that panel should be said rather than left for a reader to find. One venue was dropped from it: Deribit's funding field is exactly zero in 218 of the 999 completed hours, which is a coverage gap rather than a market reading, and including it would have manufactured a very low negative rate out of missing data. The panel is 998 hours rather than 999 because one further hour carries no Bitget value. And our own panel is not gap-free either: those 999 hours span 1,026 clock hours, so 27 hours are missing, six on 2026-07-01 and twenty one across 2026-07-31 and 2026-08-01. That is 2.6% of the window, it is the same class of problem we excluded Deribit for, and it belongs in the same breath.
A day on, at 2026-08-11 07:00 UTC, that same hourly panel had every one of these venues positive. Put on a common eight hour basis the readings ran from 0.0021% on Binance up to exactly 0.0100% on OKX, Bitget and Hyperliquid, a spread of 0.0079 percentage points with nobody on the other side of zero. That three way tie at the top is not three books agreeing: 0.0100% is the fixed interest-rate component named earlier, and it is what a venue prints when its own premium is small enough to leave the formula showing. That is the ordinary case, which covered 63.3% of the four venue settlements in this window.
How can you check this yourself?
Every settlement figure above is reproducible from public endpoints without an account, and the method is four steps rather than a black box. The hourly panel readings are the one exception, because they come from sampling those same public endpoints once an hour rather than from the settled history, so matching them means running that sampler yourself.
Step | What to do | Why it matters |
|---|---|---|
1 | Pull each venue's own funding history for its BTC perpetual over the same start and end time | Avoids trusting any aggregator, including ours |
2 | Floor each settlement timestamp to the hour before joining the four series | Binance stamps its settlement time with a few milliseconds of drift while the others land exactly on the hour, so an exact match silently drops more than a third of Binance's rows, 37.5% of them here |
3 | Keep only timestamps all four venues report | Gives every count one denominator, here 128 |
4 | Count signs, then count how many venues are negative at each timestamp, and compare that against what independent venues would give | The comparison is what stops an ordinary result being read as a co-movement story |
Step 2 is not a detail. Joining on the exact millisecond dropped 48 of the 128 settlements in our first pass and quietly moved Bitget's rate from 20.3% to 16.3%, which would have been a wrong number produced by clean-looking code. If your join throws away rows, check what it threw away before you trust the total.
If you want the arithmetic without the data engineering, the Athenum funding rate calculator turns a rate and an interval into an annualised cost on a position, and the Athenum liquidation price calculator is next door for the risk side of the same trade. Both are part of a set of 34 free calculators that need no account. On the reading side, an earlier Athenum post on weighting funding by open interest covers the sensible way to collapse these venues into one number when you do want a single figure, and our study of how funding behaves in the hours before settlement covers the timing question this post deliberately leaves alone.
What this does not show
Four limits, stated plainly. The window is six weeks of one asset, and six weeks that contained no sustained downtrend, so it says nothing about what a real bear leg does. Athenum's own earlier work is the proof of that: a 72 hour funding collapse we documented from +6.6% to -12.5% APR and a -35% APR episode at $75K are both far outside anything in this window. Negative funding can be deep and broad, and nothing here should be read as saying otherwise.
Second, the venue set is four exchanges chosen because they publish comparable eight hour settlement histories, so a different four would give different counts. Third, the unanimity result is descriptive rather than inferential: as shown above it is what independence predicts, so it supports no claim about venues being unusually disconnected. And fourth, the hourly panel is a different sampling of the same published fields rather than a separate measurement of the market, so agreement between the two is a check on the settlement grid rather than confirmation from an outside source.
What survives all four is the part that should change practice. The frequency with which you see a negative funding rate is a property of the venue you are reading it from, and the gap between the extremes of this set is large and statistically solid. Quoting one venue's sign as a market fact requires checking at least one other, and in this window, when the venue you happened to read was the negative one, a second venue disagreed with it 151 times out of 171, or 88.3%.
Everything above came off public endpoints and Athenum's live cross-venue derivatives feed, and the 34 calculators beside it stay free, with no account, no email and no usage limits. The next settlement is eight hours away at most, and a free 7 day Athenum Pro+ trial puts every venue's rate on one screen before it prints.
One terminal. All the data.
Liquidations, orderbook depth, whale walls & open interest from 4 exchanges, all real-time, in one place.
No credit card required

Athenum Analytics
Athenum Analytics is our three-person editorial team covering crypto derivatives, market data and macroeconomic context.