Blog
Page 6 of 10
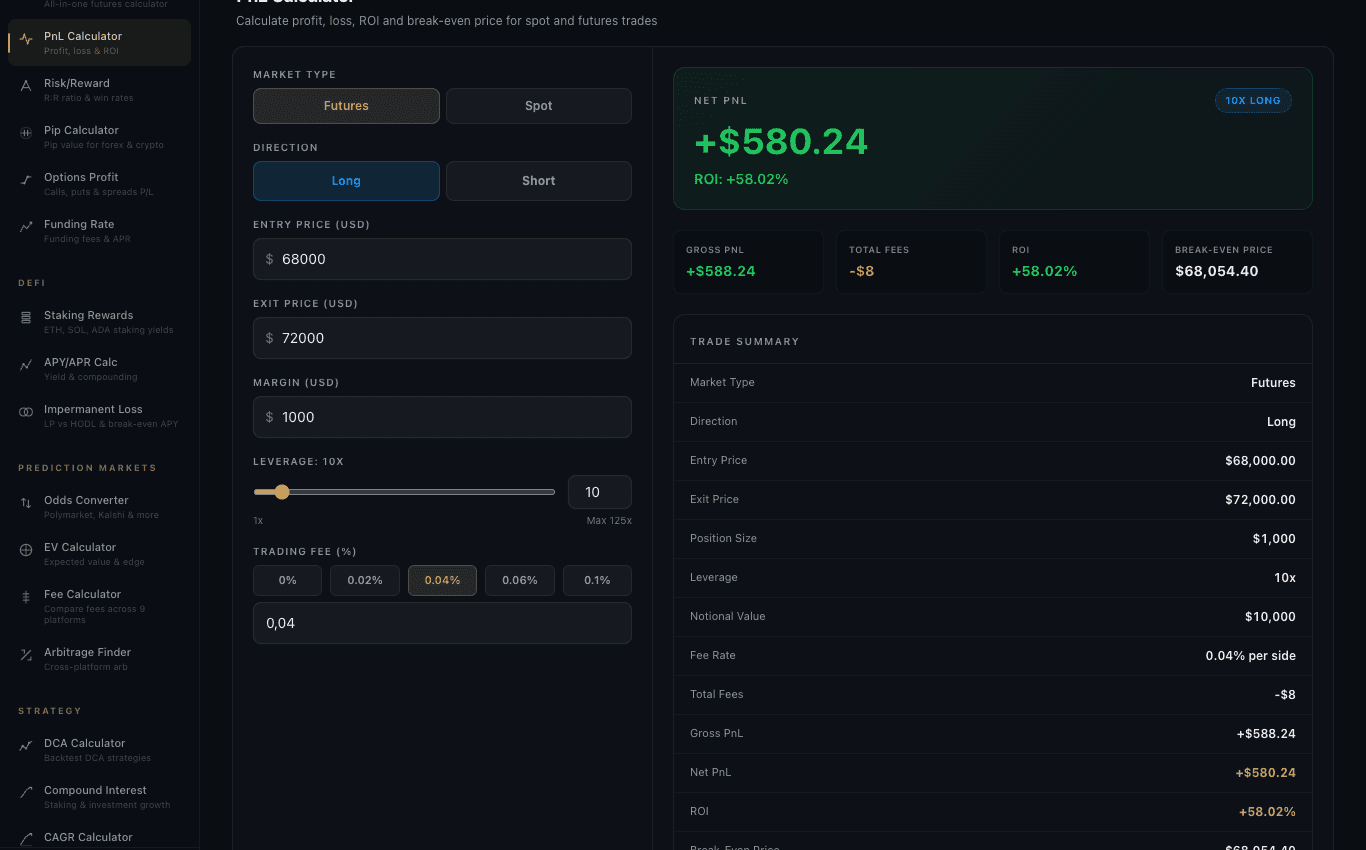
Crypto PnL Calculator: How to Calculate Profit, Loss and ROI on Futures Trades
The exact long and short PnL formulas for crypto futures, how ROI on margin differs from raw profit, and a worked long plus short BTC example showing how fees and funding cut into realized PnL.
 Athenum Analytics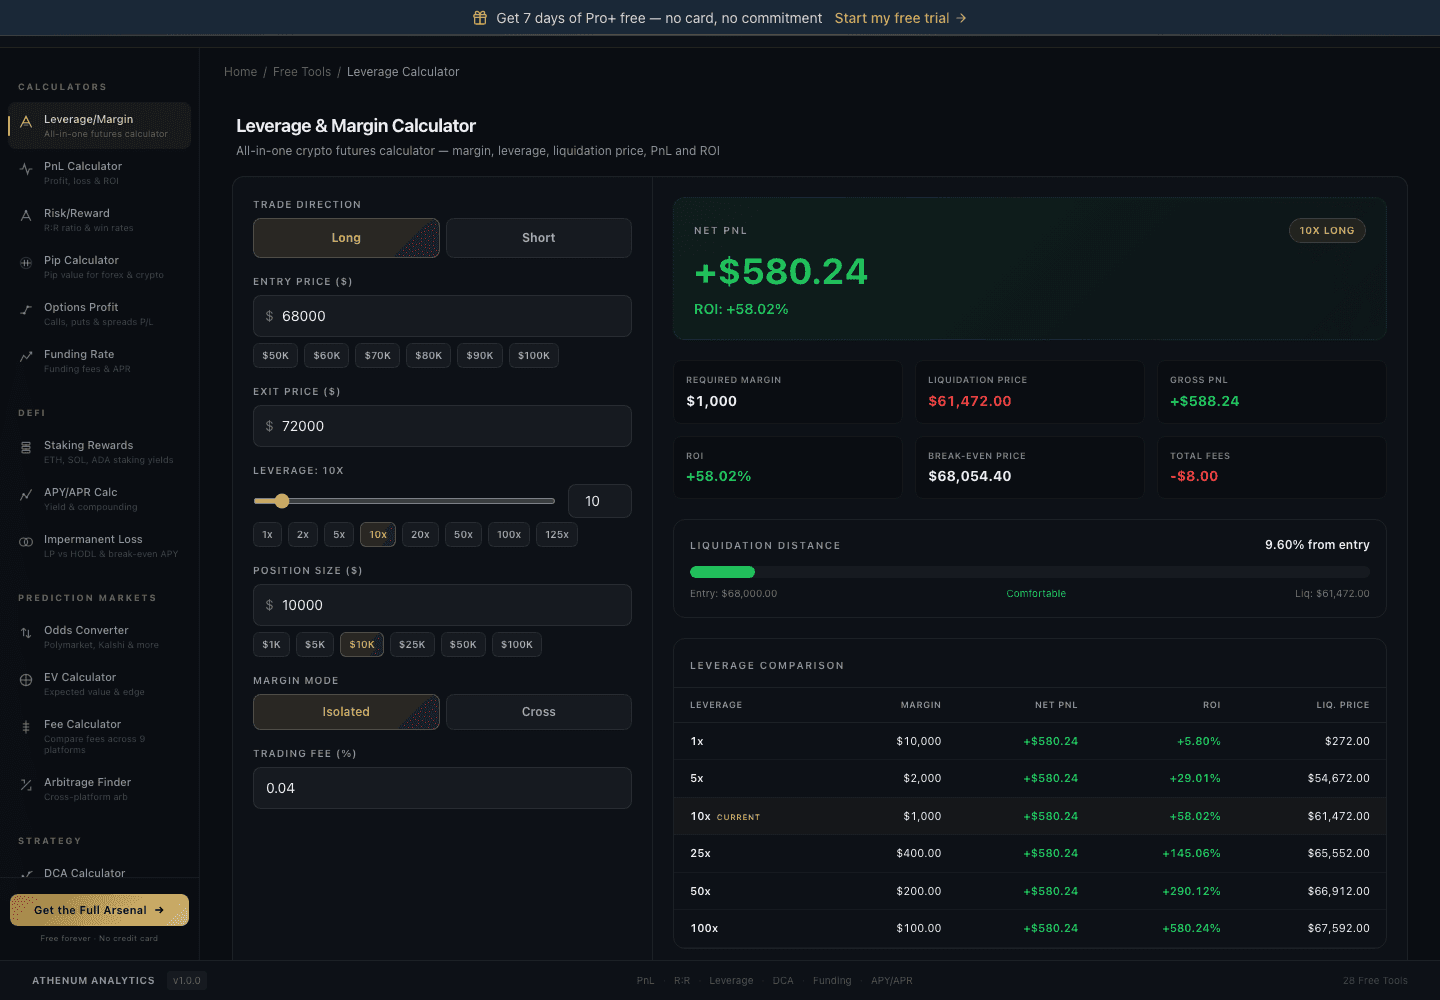
Crypto Margin Calculator: How to Calculate Required Margin, Isolated vs Cross, and Liquidation Buffer
A margin-focused guide to crypto futures: how to calculate required (initial) margin, maintenance margin, margin ratio, and how those numbers set your liquidation buffer. Includes a worked BTC example, a numbered methodology, and an isolated vs cross comparison table.
Athenum Analytics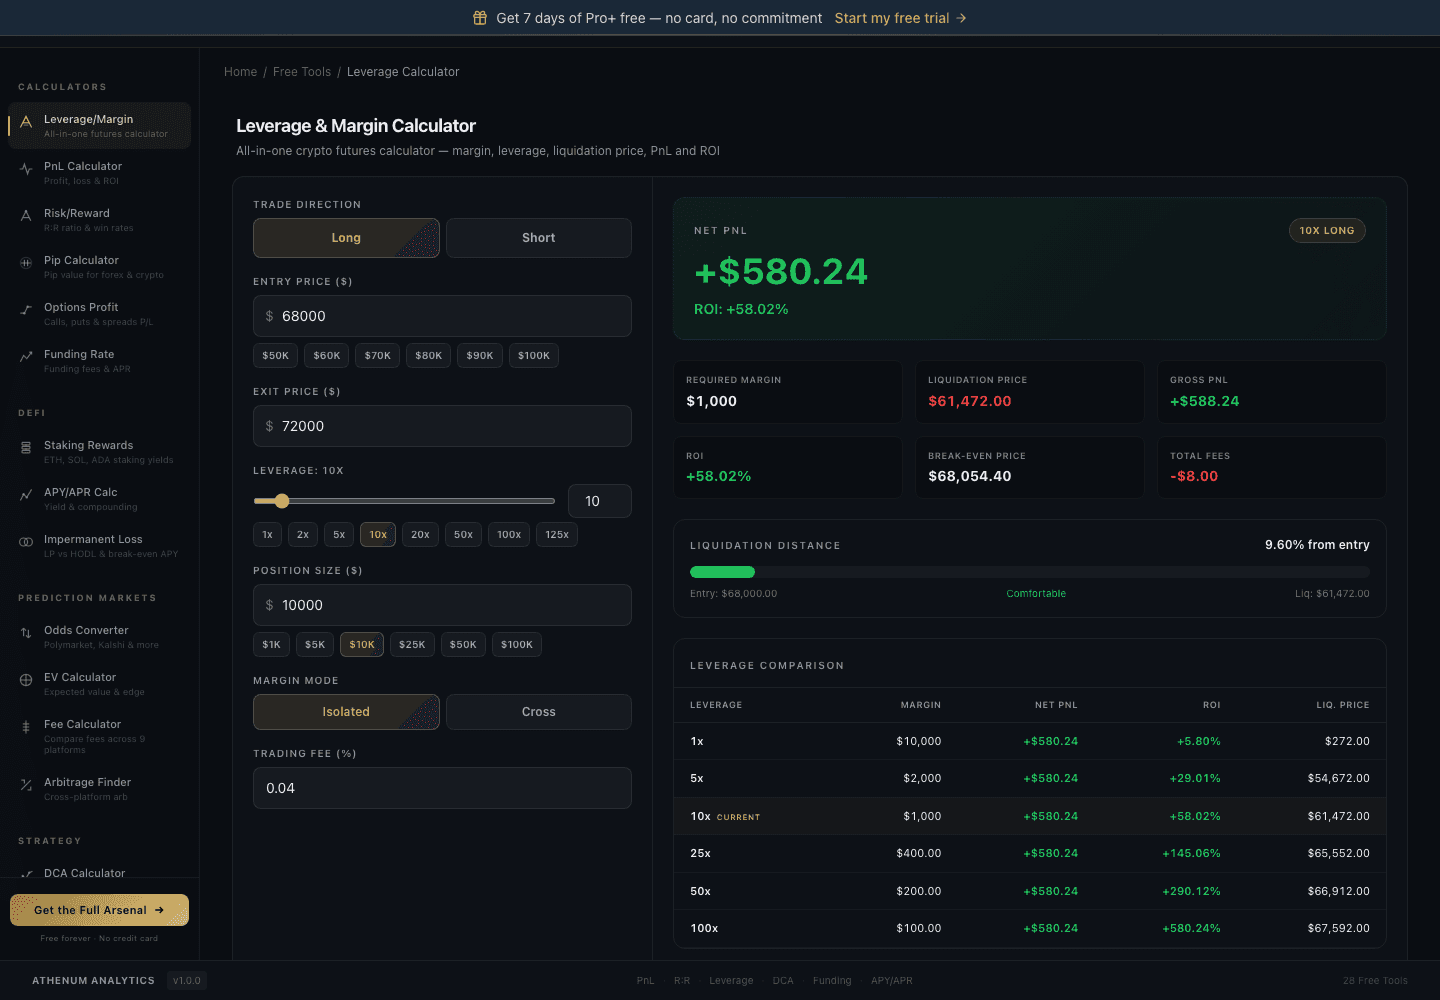
How to Calculate Crypto Leverage, Margin, and Liquidation Price (with a Free Calculator)
A practical, formula-by-formula guide to computing margin, liquidation price, and PnL on a leveraged crypto trade, worked through a real 10x BTC long. Pair it with the free crypto leverage calculator on Athenum to size any position before you click.
Athenum Analytics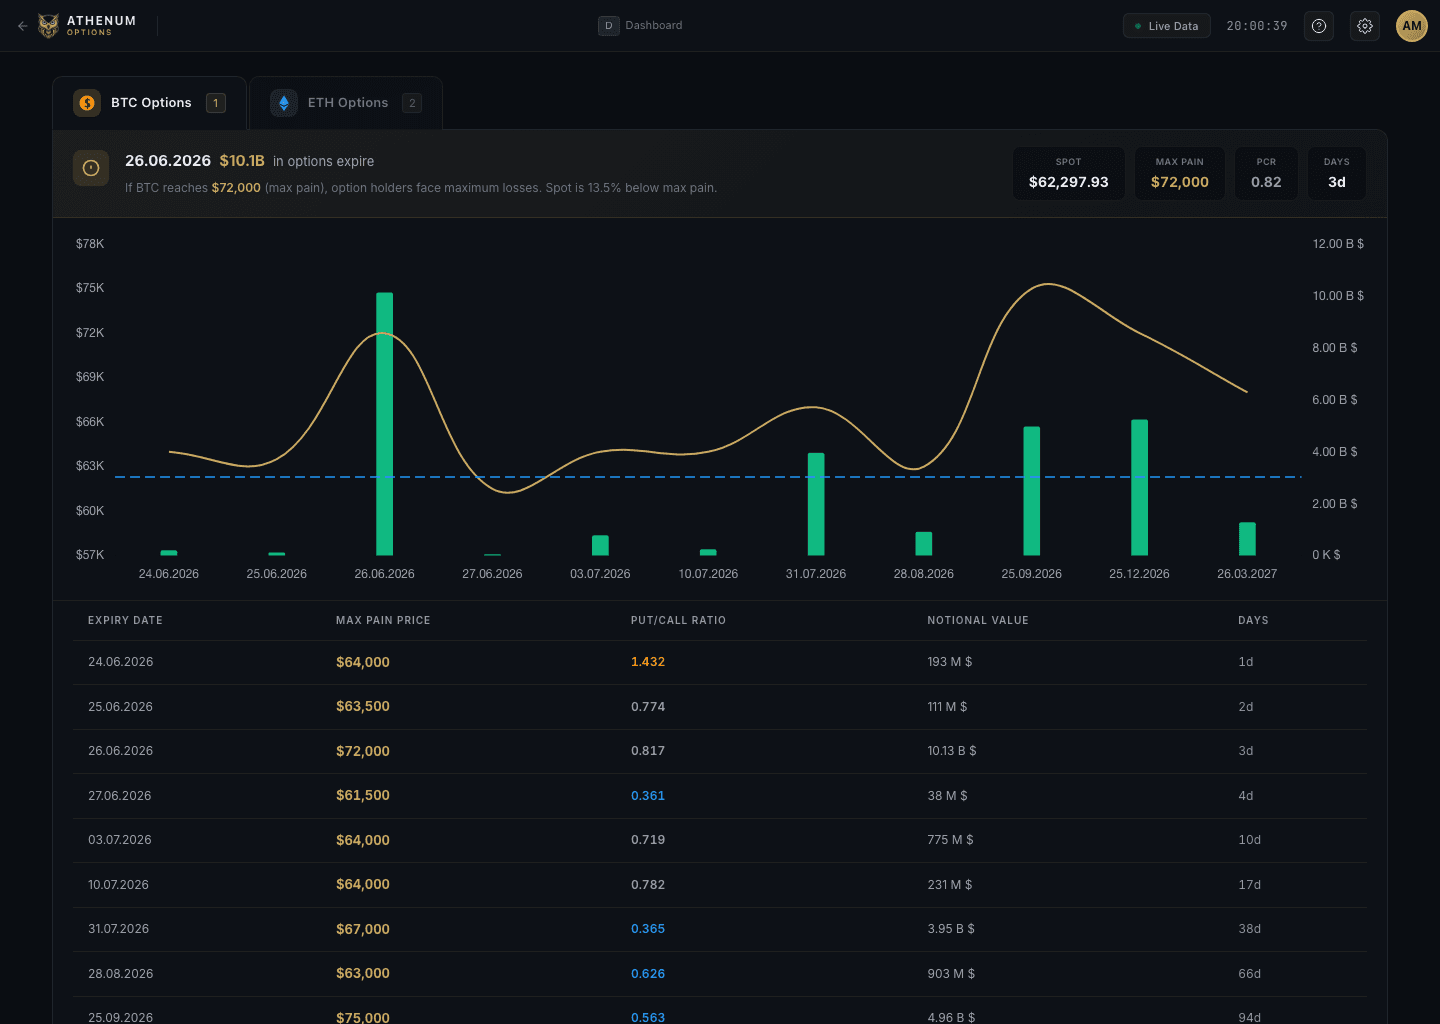
Options Max Pain in Crypto: What the Max-Pain Price Means and Why Price Drifts Toward It
Options max pain is the strike where the most option value expires worthless. Here is how the max-pain price is built, what the put/call ratio adds, and how to read both on a live BTC options map.
Athenum Analytics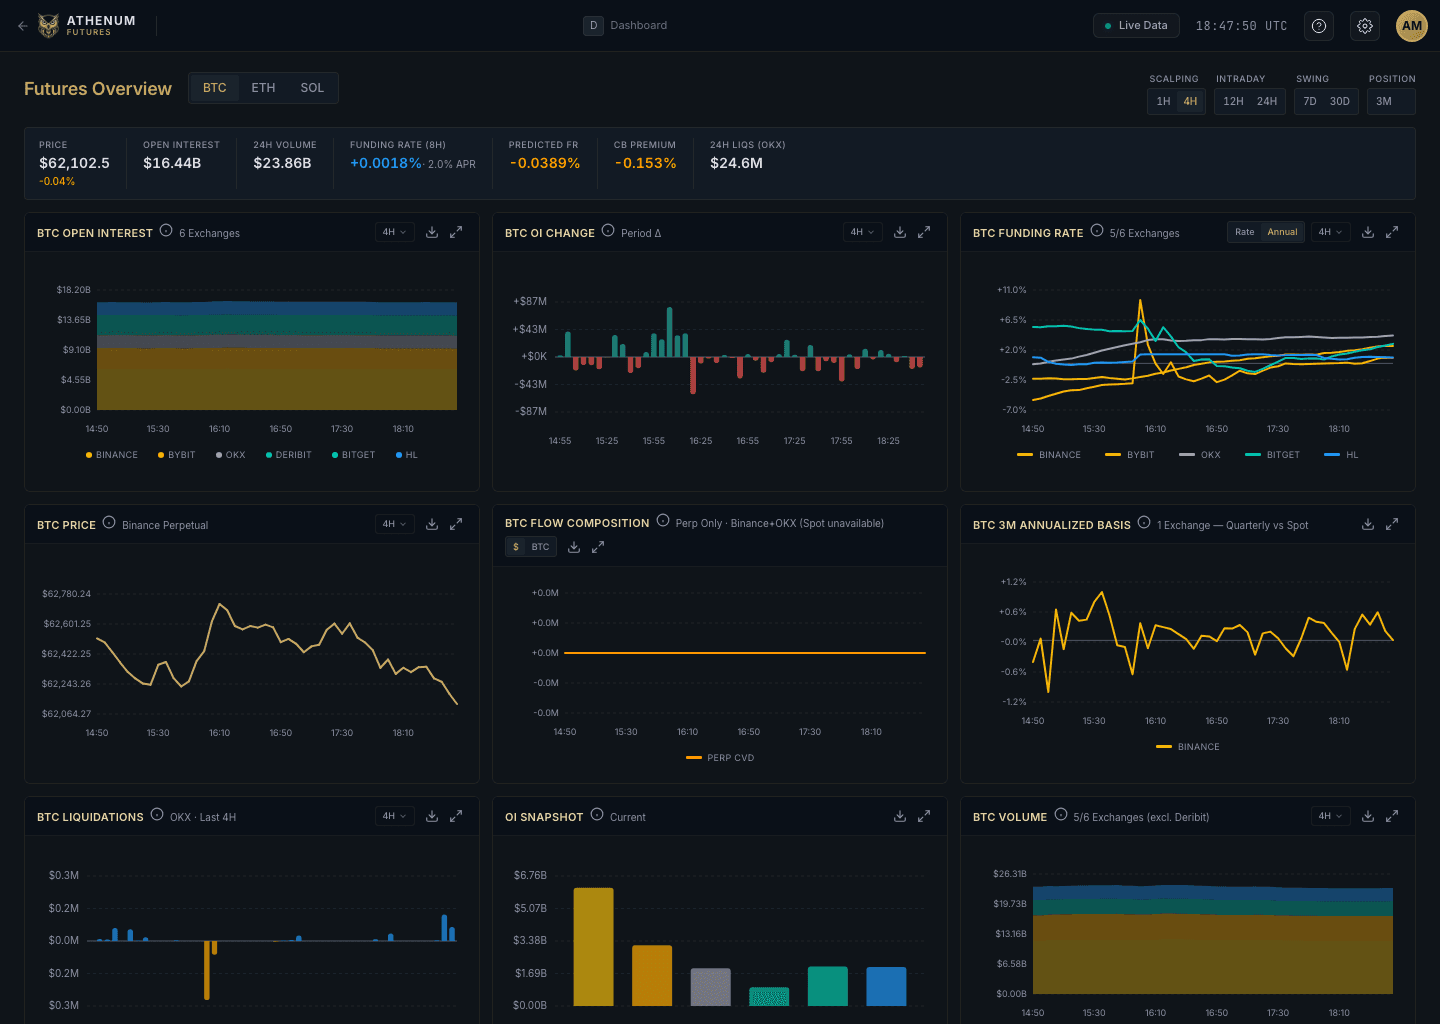
Athenum Cross-Exchange Derivatives Index, week of 2026-06-20
A weekly read of the cross-exchange crypto derivatives tape: funding, open interest, basis, and implied volatility across Athenum's coverage of 14 exchanges, as of 2026-06-20.
Athenum Analytics
Bitcoin as Digital Gold: How the Safe-Haven Correlation Actually Behaves
Bitcoin shares gold's monetary properties but not its price behavior; the BTC-gold correlation is low, unstable, and regime-dependent, so check the live regime.
Athenum Analytics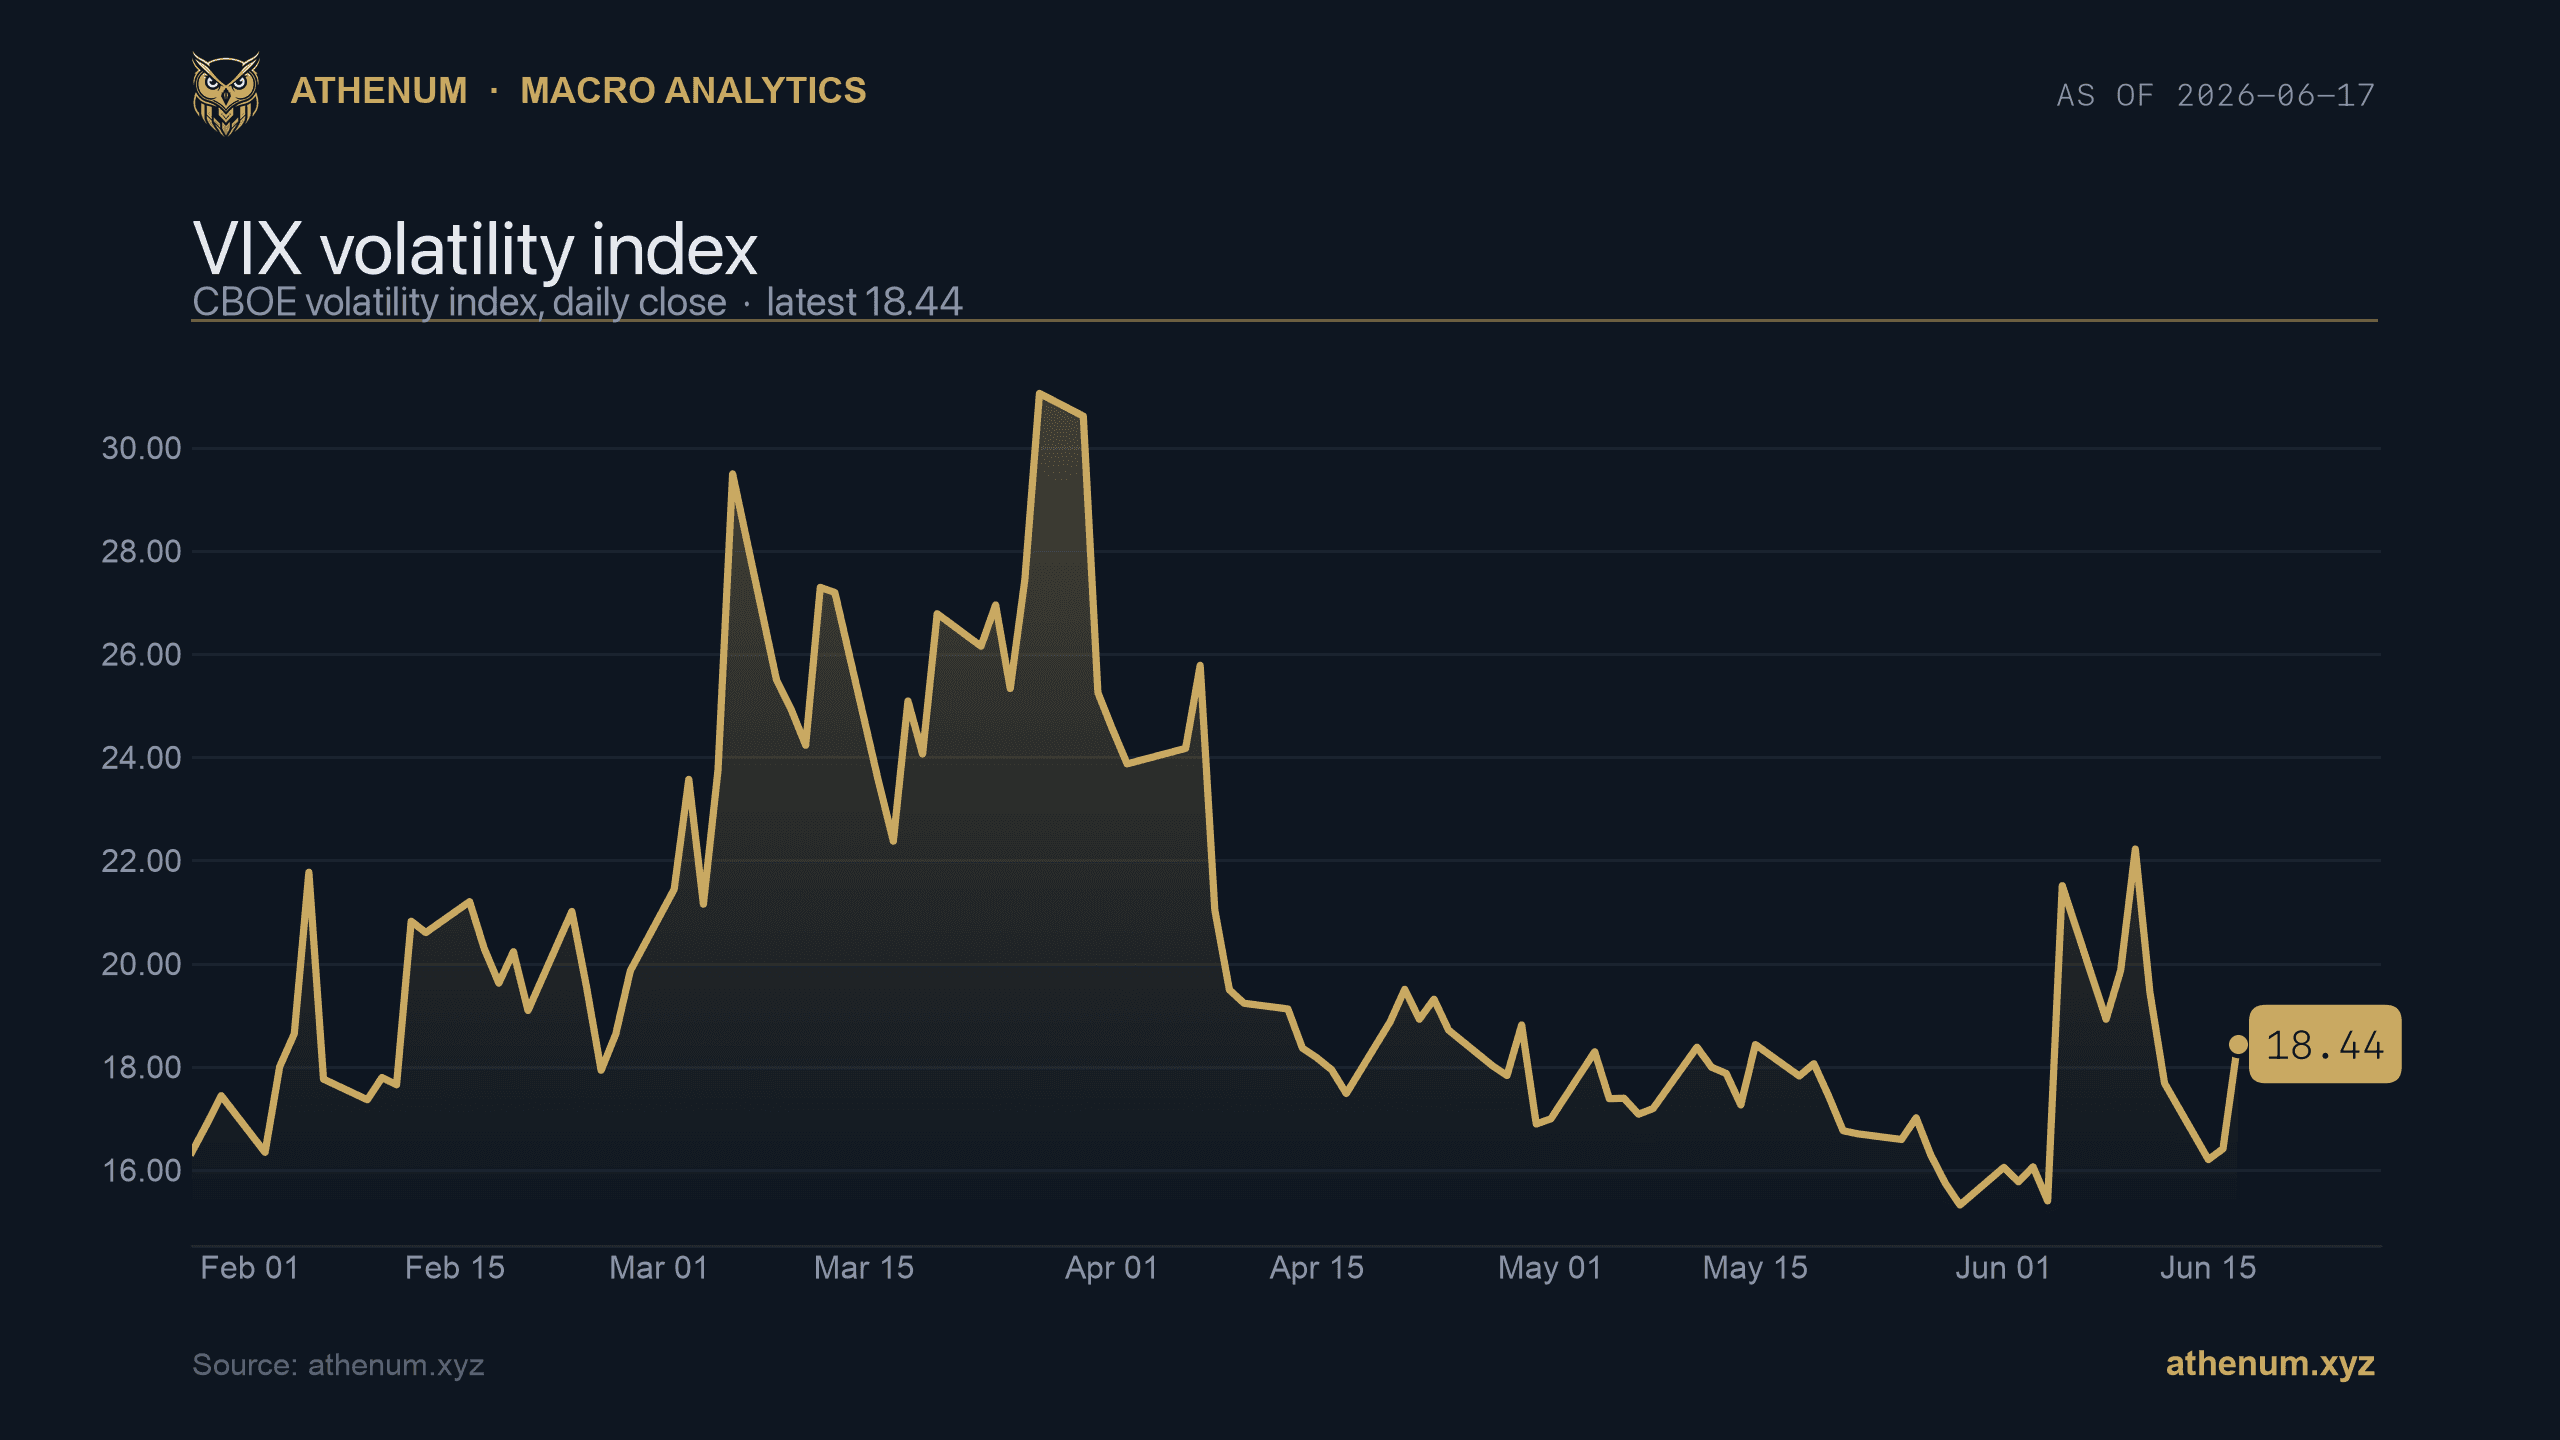
Macro Regime Neutral at 0.45 Confidence as VIX Holds at 25.33 and BTC Faces a $14.8B Quarterly Options Expiry
Date: March 27, 2026 | Data source: Athenum Analytics API, Deribit, Coinglass
Athenum Analytics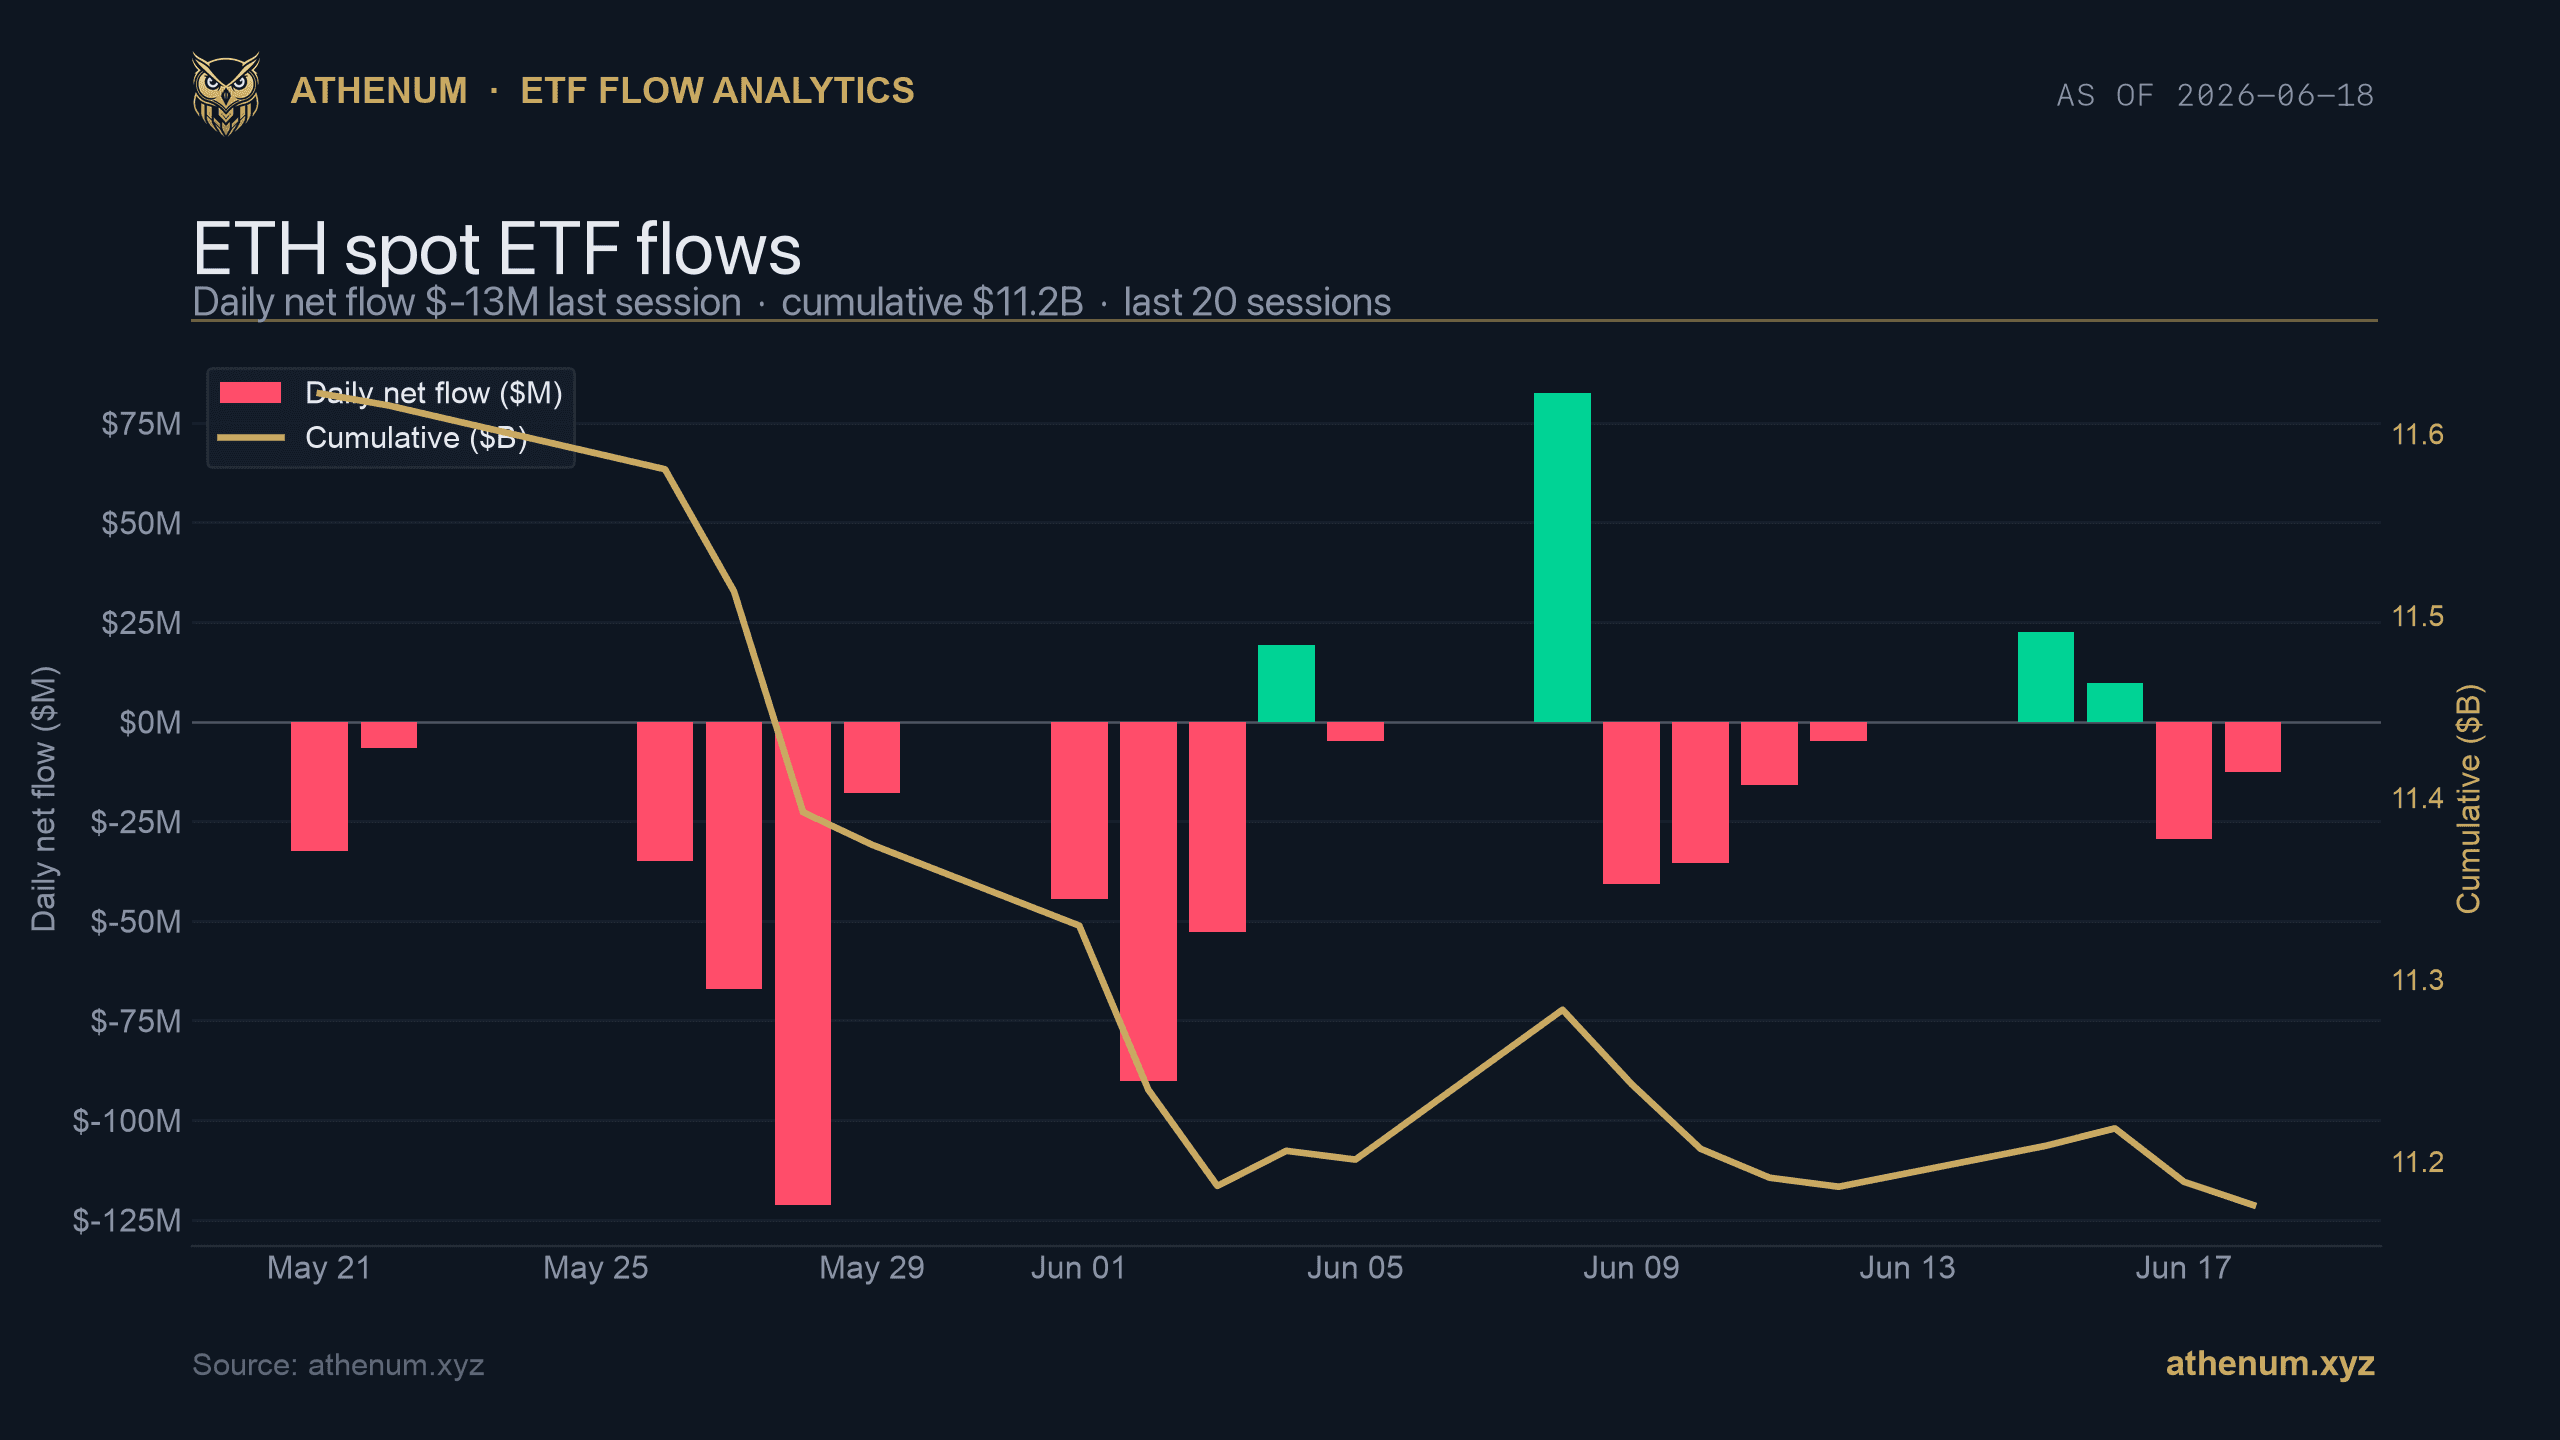
Eight of the Last Ten ETH ETF Sessions Printed Outflows
Ethereum ETFs have logged eight net outflow sessions in ten trading days, with Athenum flows and derivatives data showing a controlled but persistent reduction in listed ETH exposure.
Athenum Analytics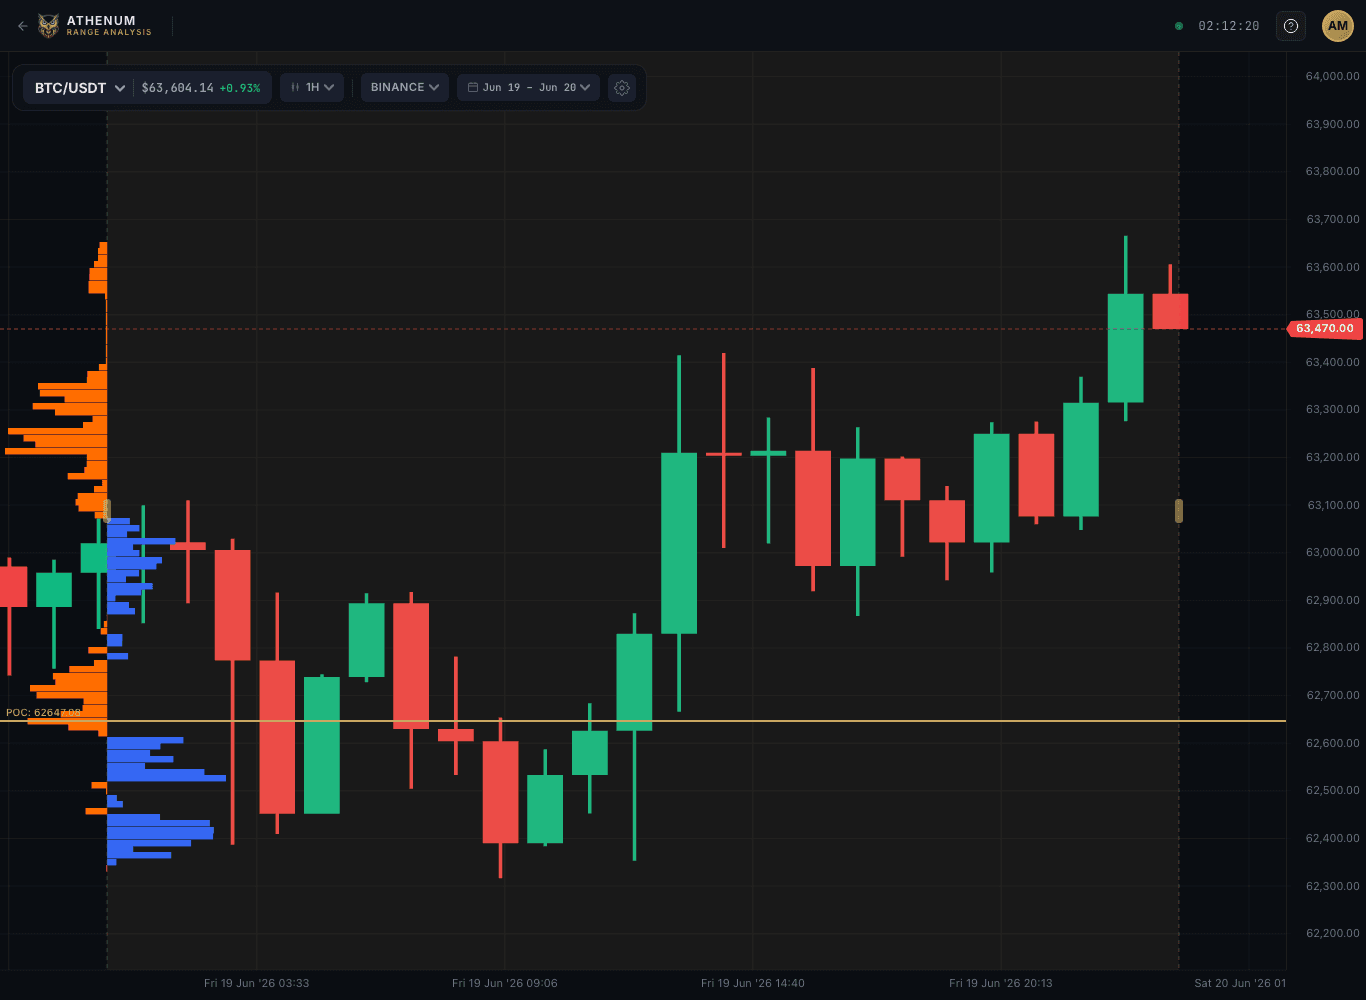
VWAP and the Value Area: Reading Where Crypto Actually Trades
How VWAP, anchored VWAP, the point of control, and the value area define where crypto has actually traded, plus the honest limits of each.
Athenum Analytics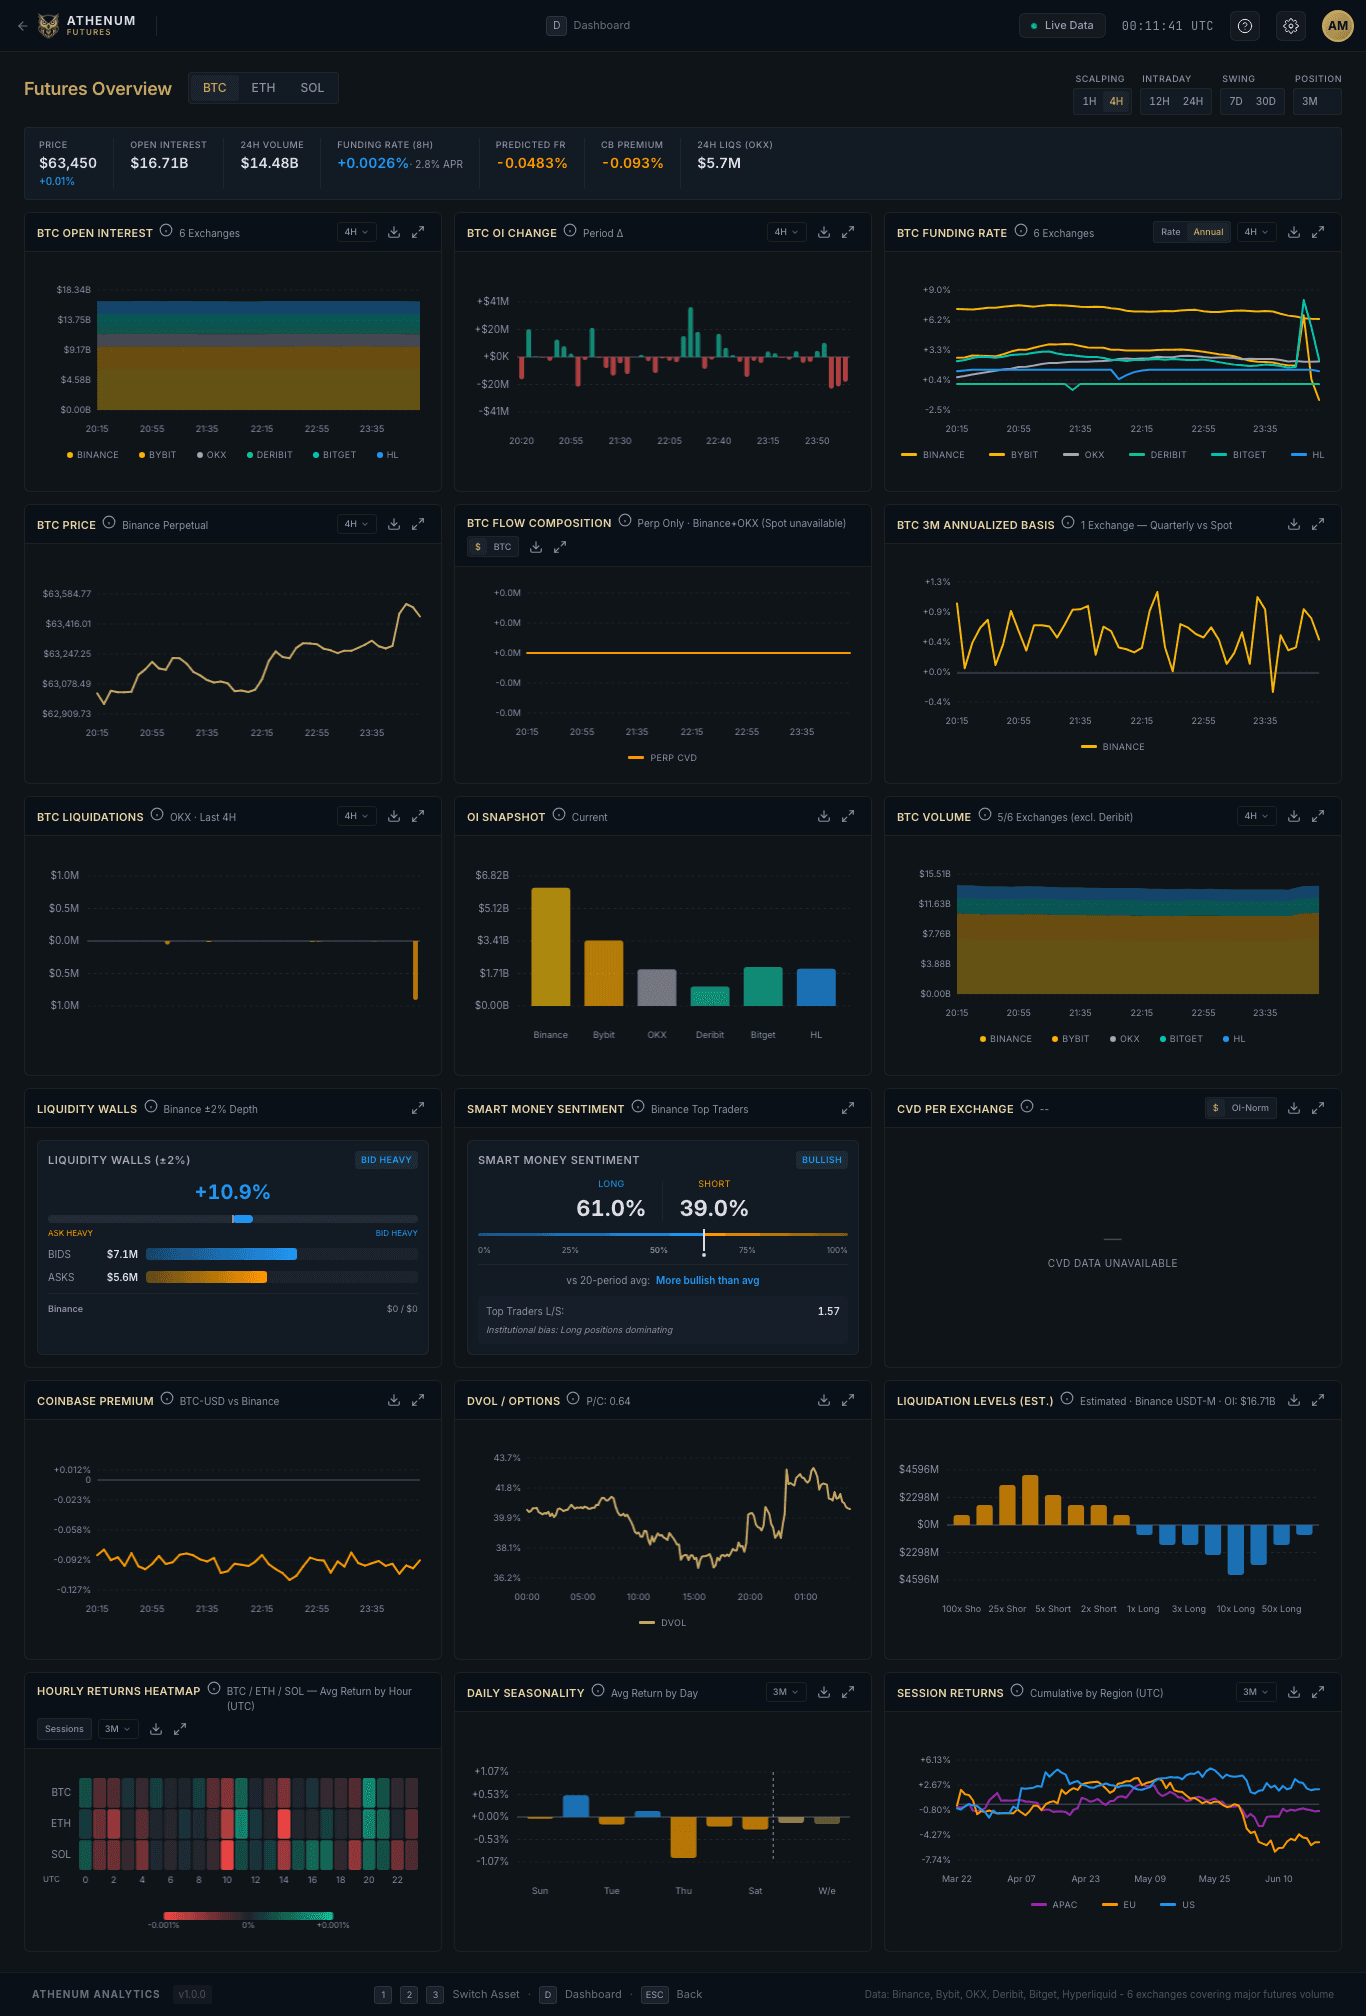
OI-weighted funding rates: calculation, intervals and limitations
An open-interest-weighted funding rate is a summary of selected perpetual contracts. Each comparable rate receives the weight of that contract's USD notional open interest. It is not the rate charged on your position, a measure of net long positions, or a forecast of the next price move.
Athenum Analytics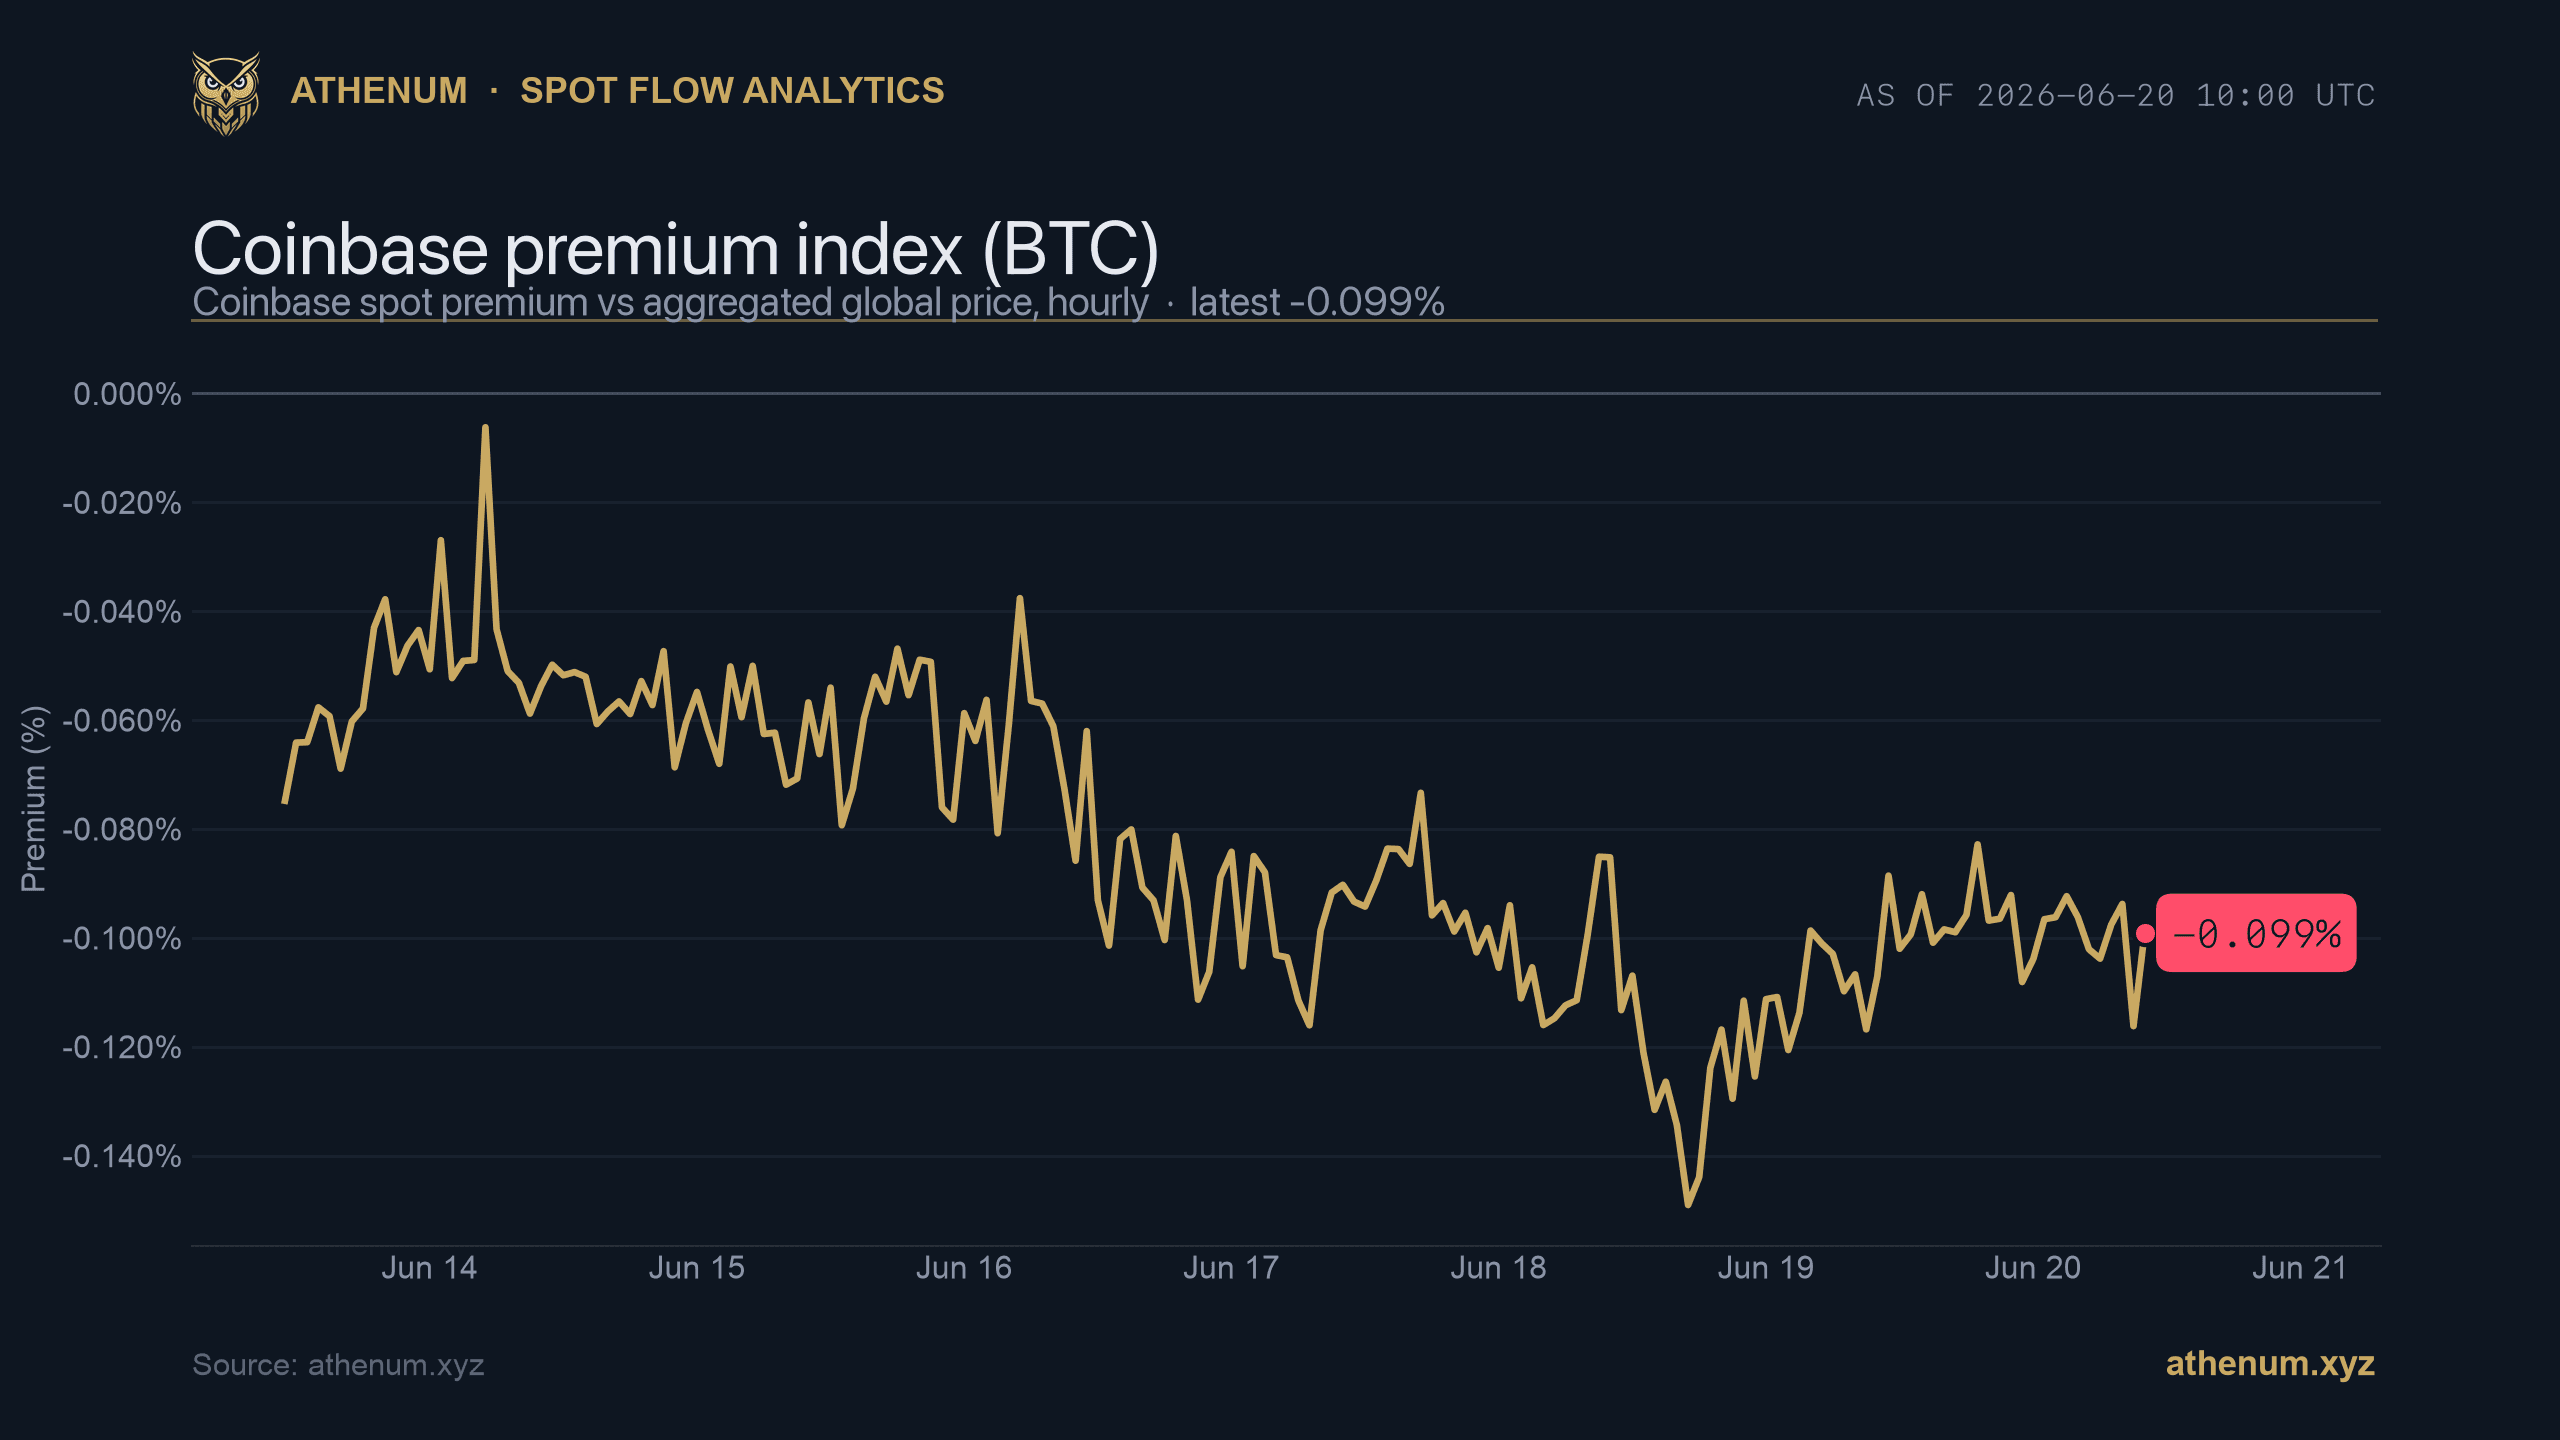
The Coinbase Premium Index: Reading US Spot Demand in Real Time
A practical guide to the Coinbase Premium Index: how it is computed, what positive vs negative means, and where this US spot-demand proxy misleads.
Athenum Analytics
Bitcoin–Nasdaq correlation: a reproducible measurement guide
Bitcoin–Nasdaq correlation describes the linear association between two specified return series over a specified window. It is not a permanent property of Bitcoin. This guide explains how to define the measurement; the [July 2026 claim audit](/blog/bitcoin-nasdaq-correlation/) addresses an earlier numerical headline separately.
Athenum Analytics