Blog
Page 7 of 10
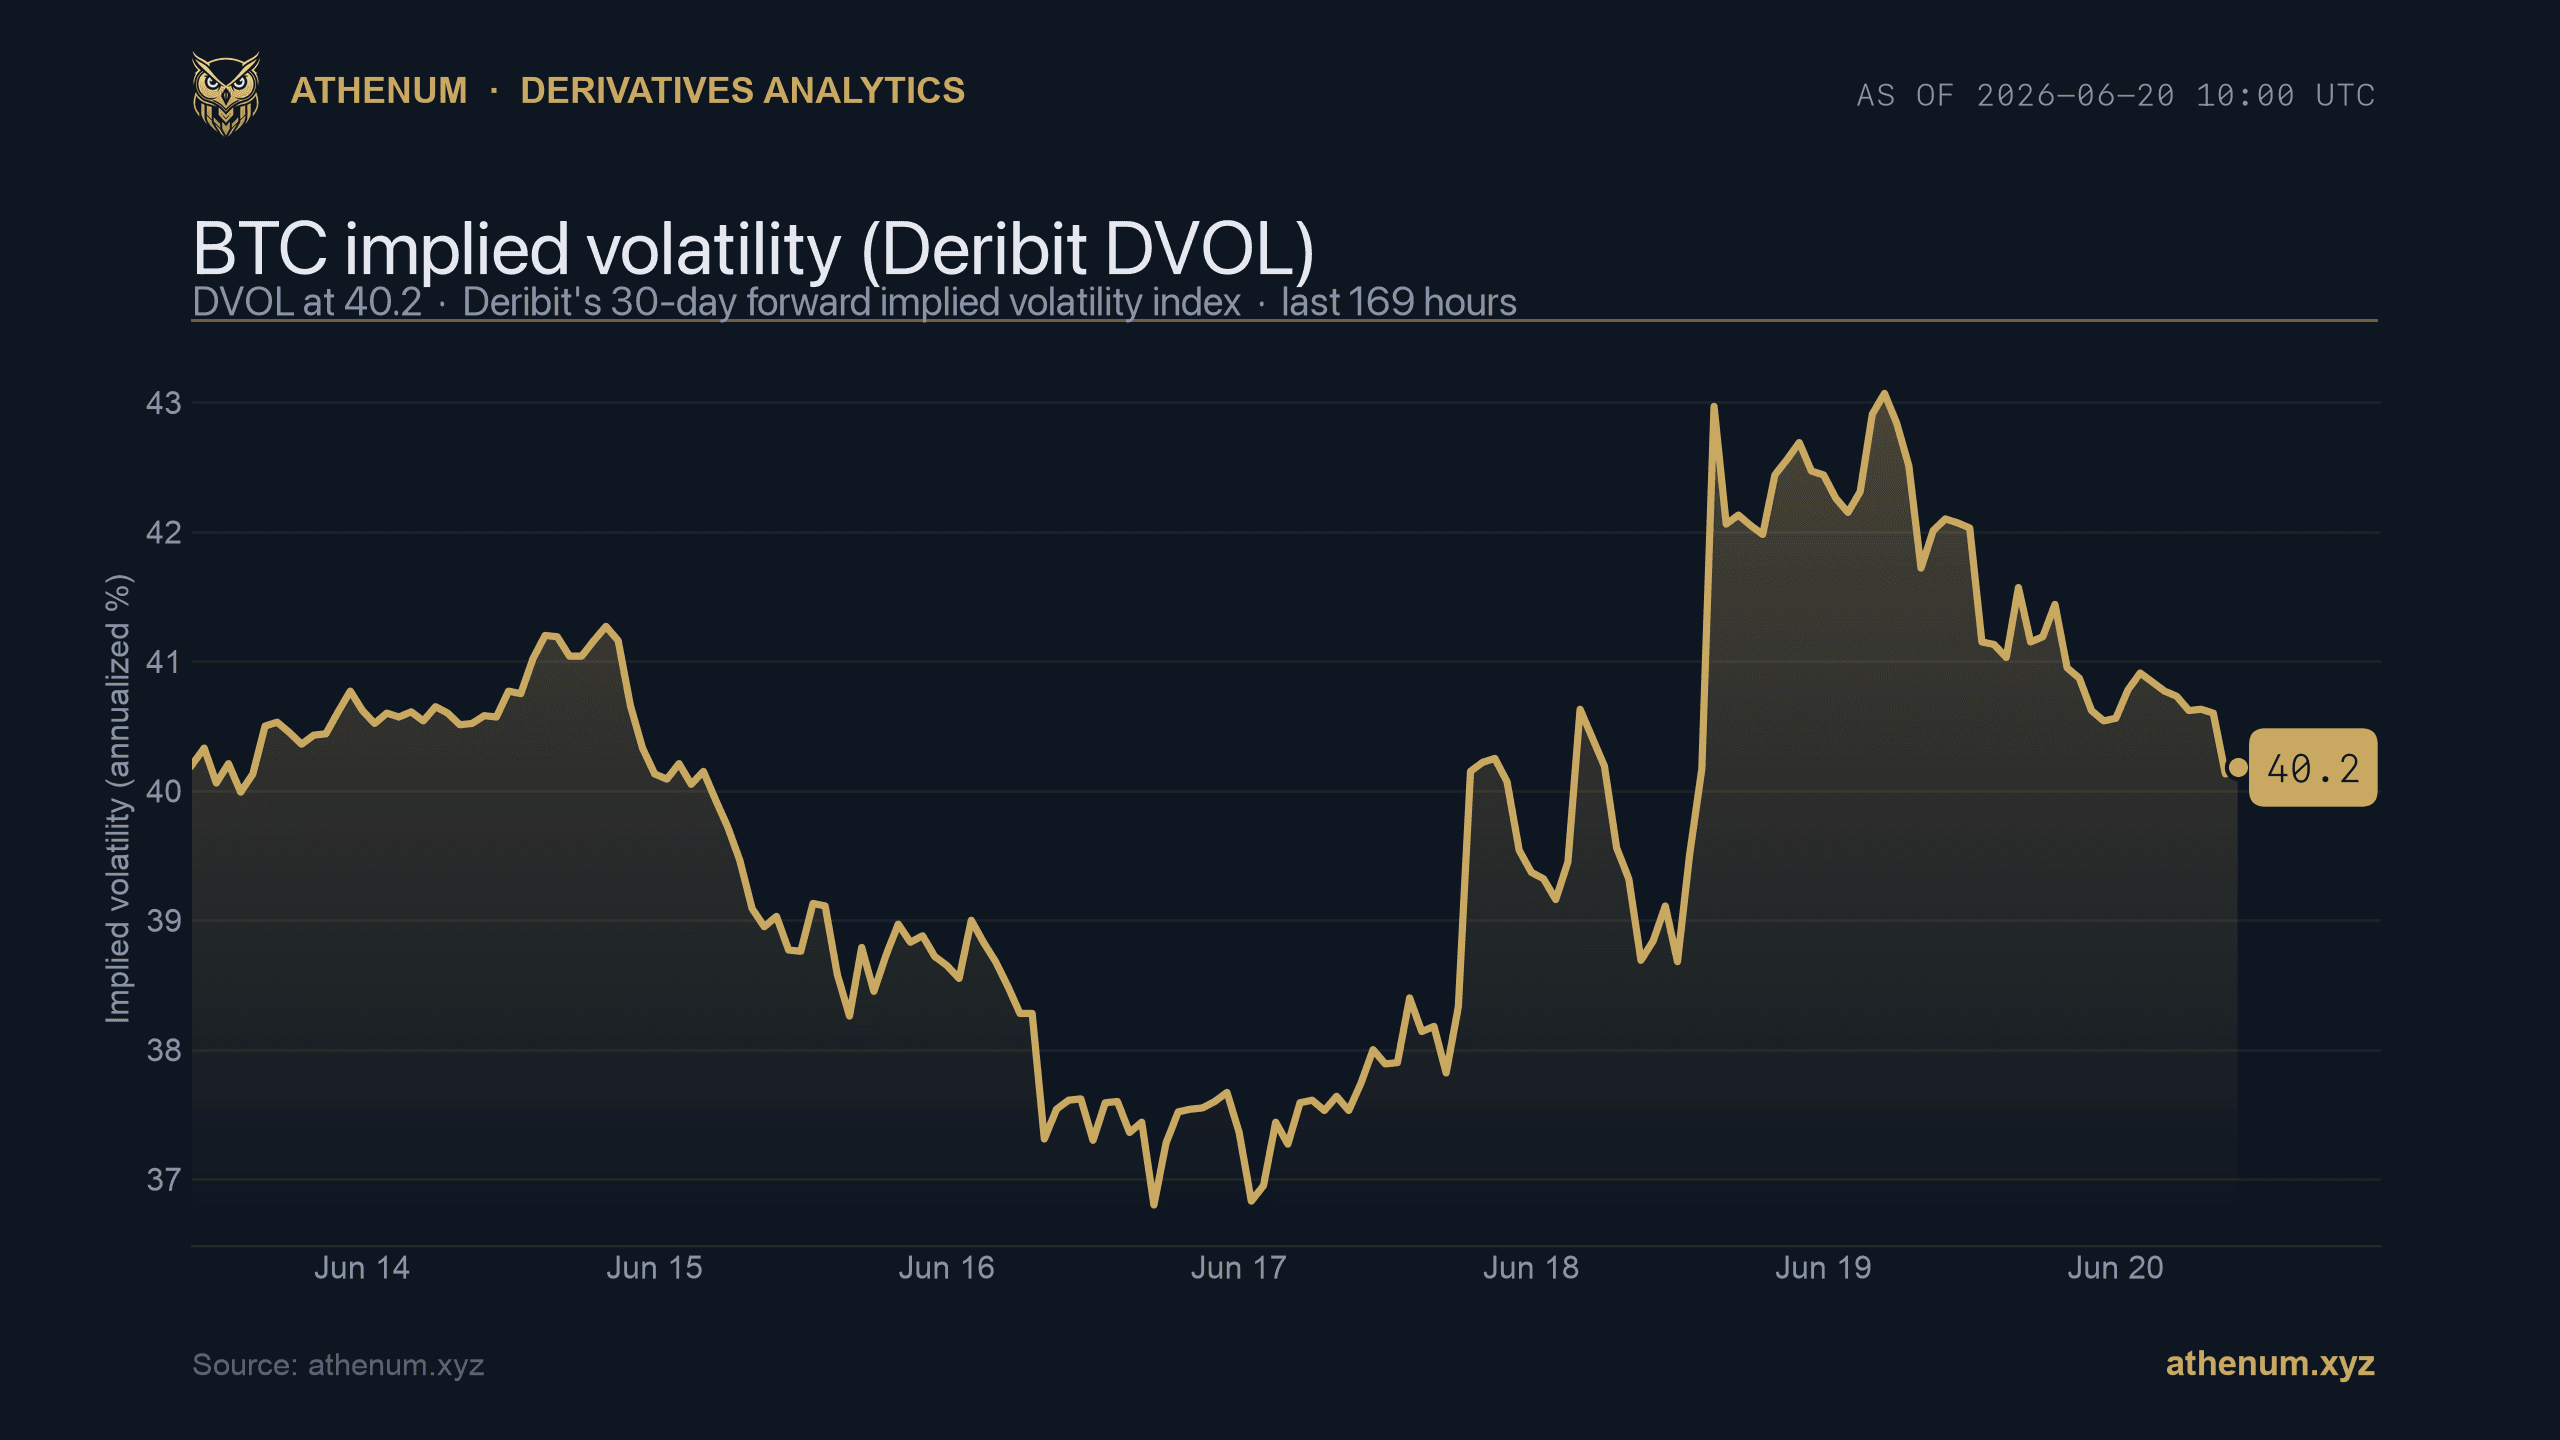
DVOL Explained: Deribit's Bitcoin Volatility Index (the Crypto VIX)
DVOL is Deribit's model-free, 30-day implied volatility index for Bitcoin, the crypto market's closest analog to the equity VIX.
 Athenum Analytics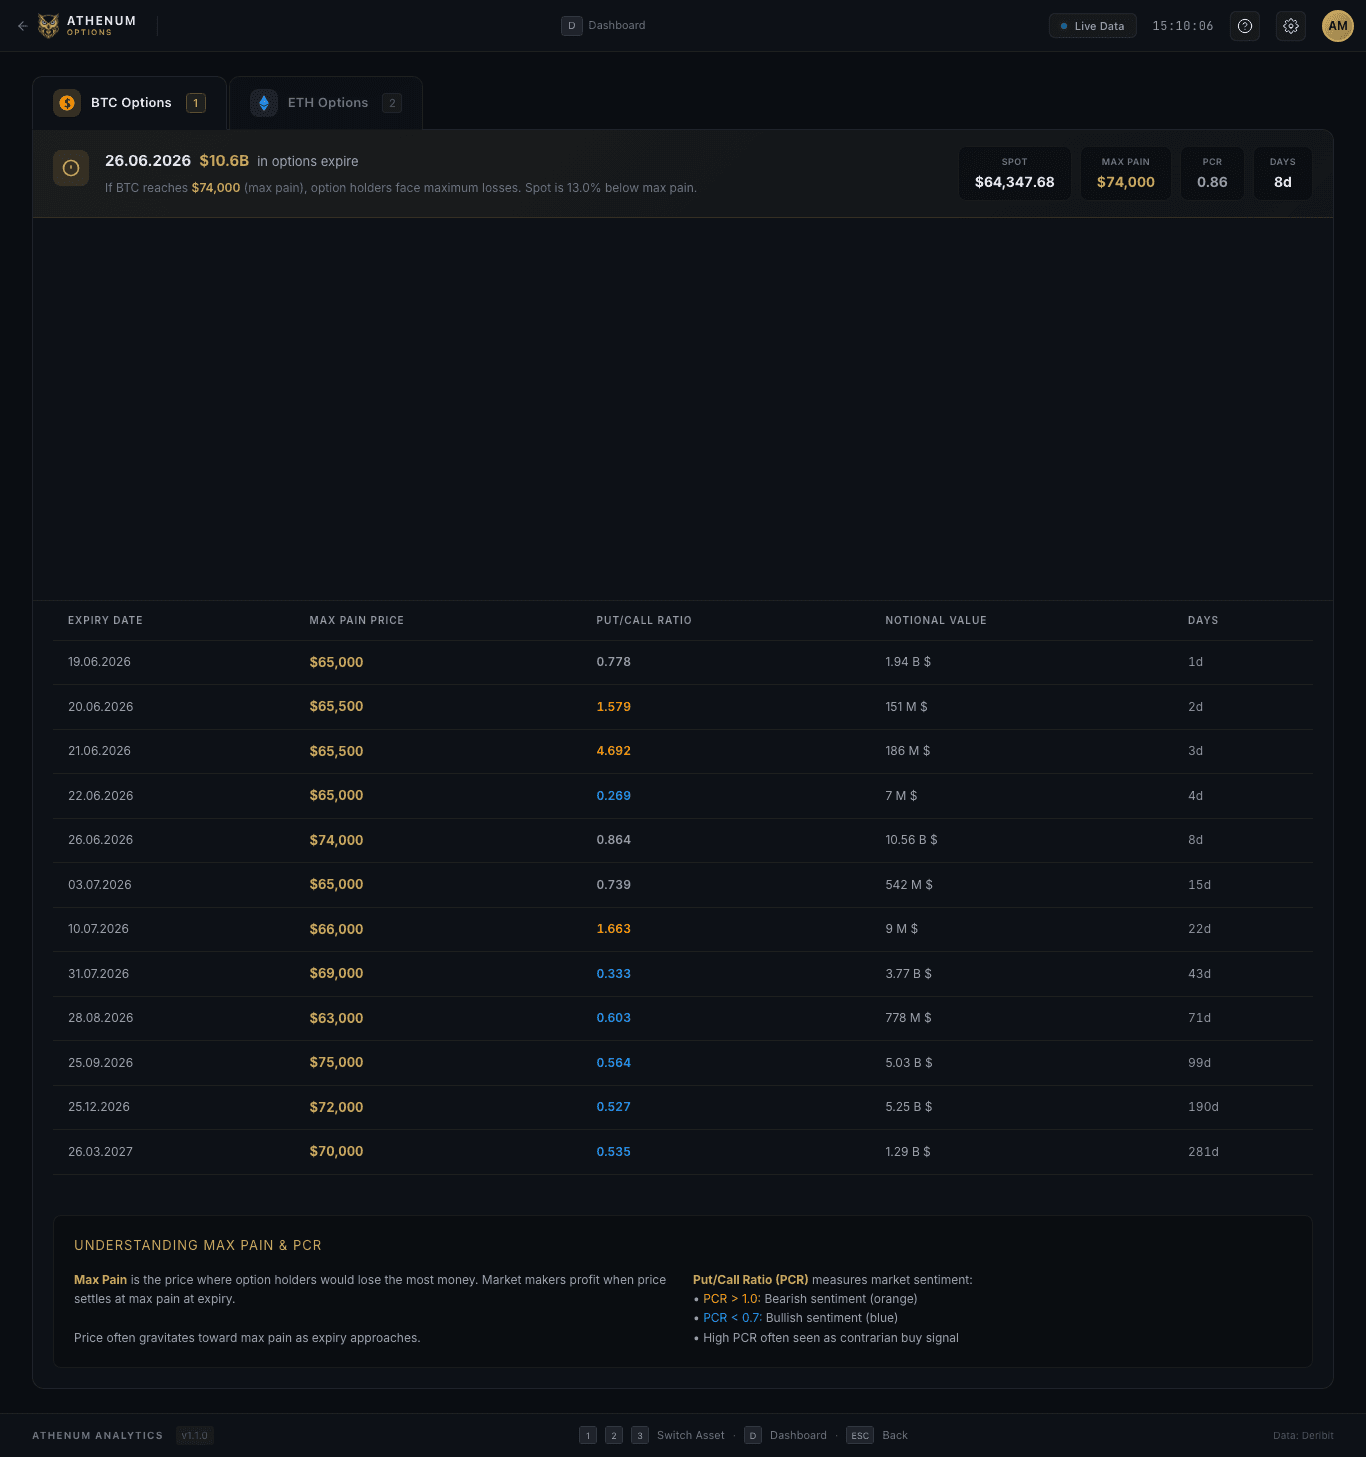
The Crypto Options Implied Volatility Term Structure, Explained
The implied volatility term structure plots option-implied vol across expiries, from front-month to back-month. Its shape tells you how the market is pricing near-term versus longer-dated uncertainty, and reading shifts in that curve is a core derivatives skill.
Athenum Analytics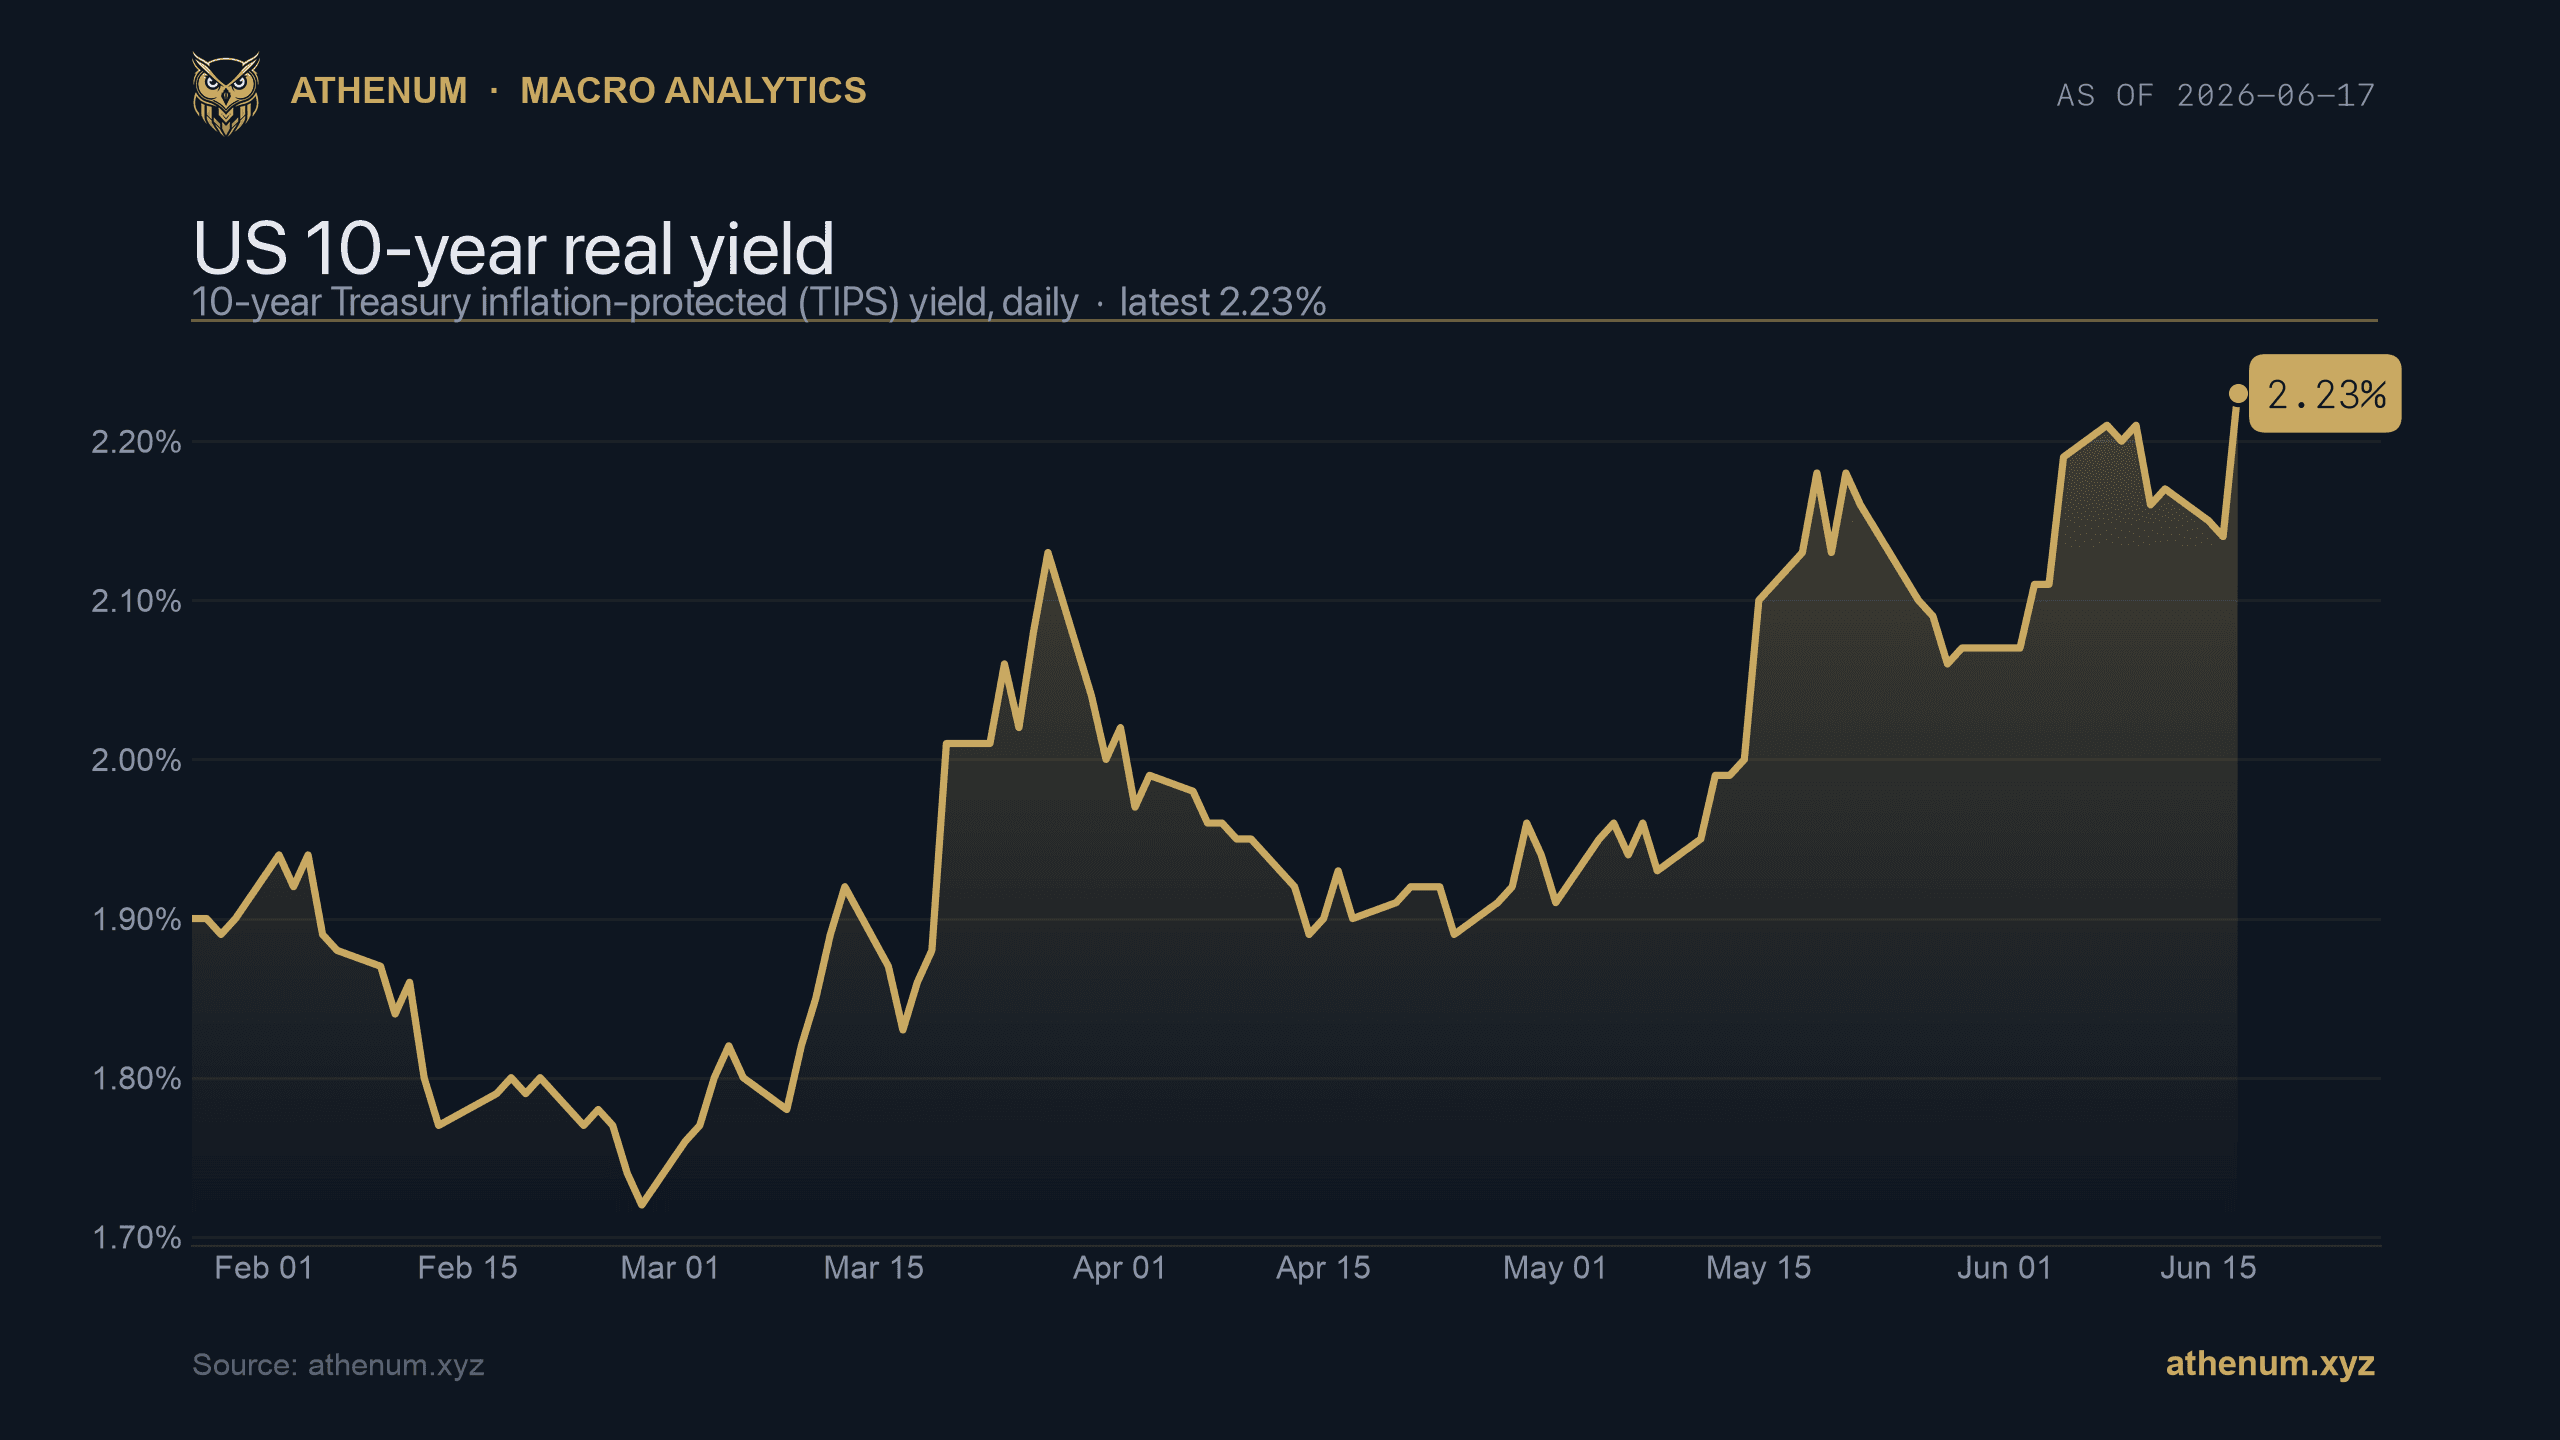
Real Yields and Crypto: How the 10-Year TIPS Yield Shapes Risk Appetite
The 10-year TIPS yield is the inflation-adjusted return on a safe asset, and it sets the opportunity cost for holding non-yielding crypto. Here is how to read real yields next to the market's own positioning data.
Athenum Analytics
Bitcoin Dominance: What It Signals About Altcoin Risk
Bitcoin dominance is BTC's share of total crypto market cap. Here is what rising versus falling dominance tends to signal about altcoin risk, where the metric breaks down, and how to read it alongside derivatives positioning.
Athenum Analytics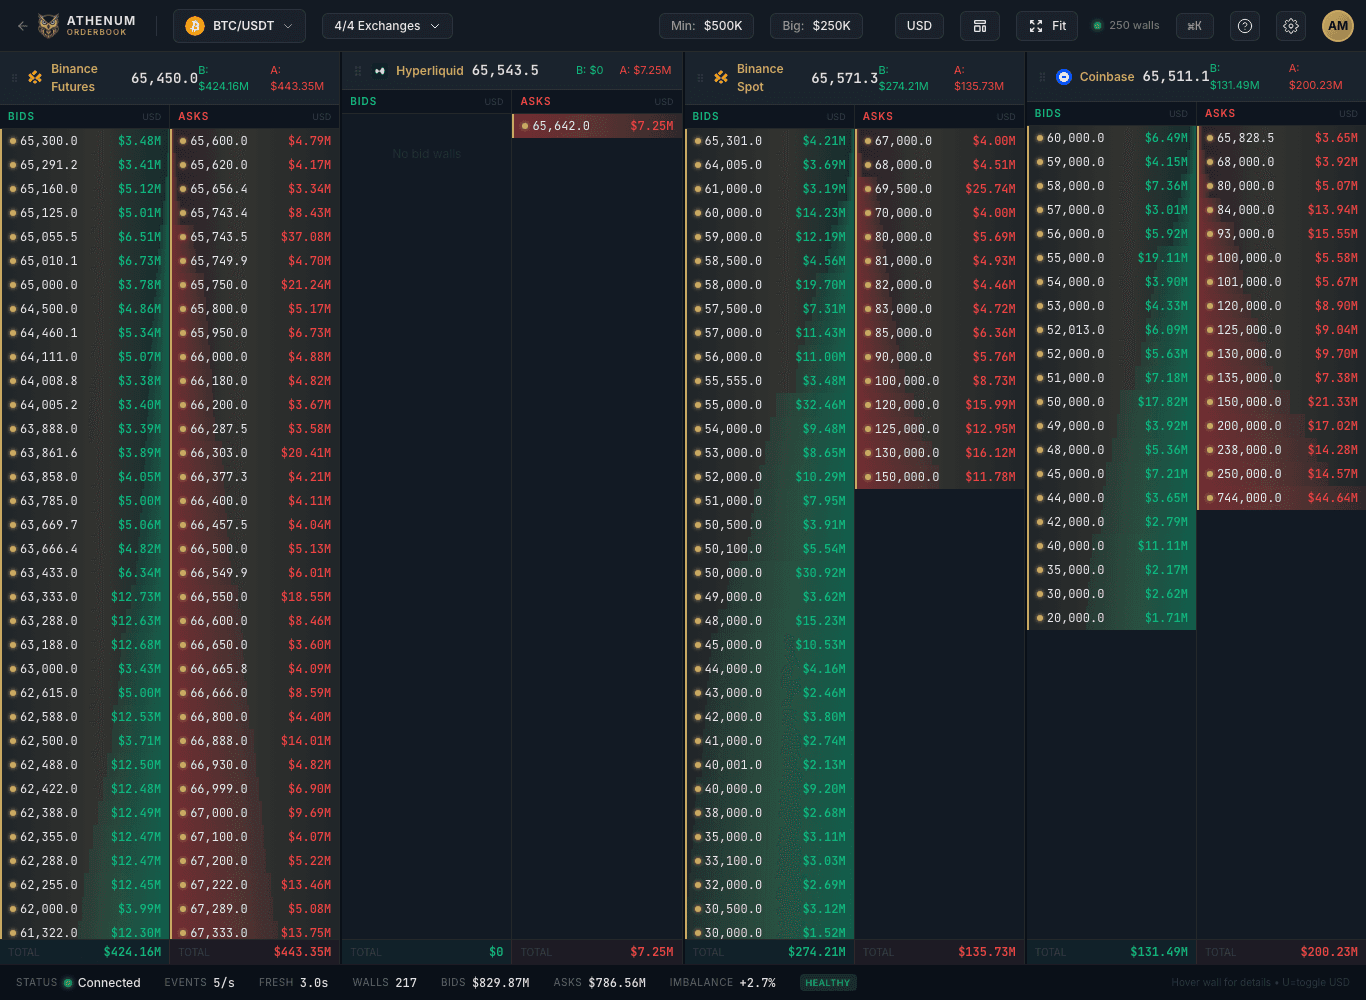
Stablecoin Exchange Flows: The Liquidity Signal That Often Moves Before Derivatives
Net stablecoin inflows to exchanges describe the deployable margin behind leveraged positions, a capacity signal that often registers before open interest and funding move.
Athenum Analytics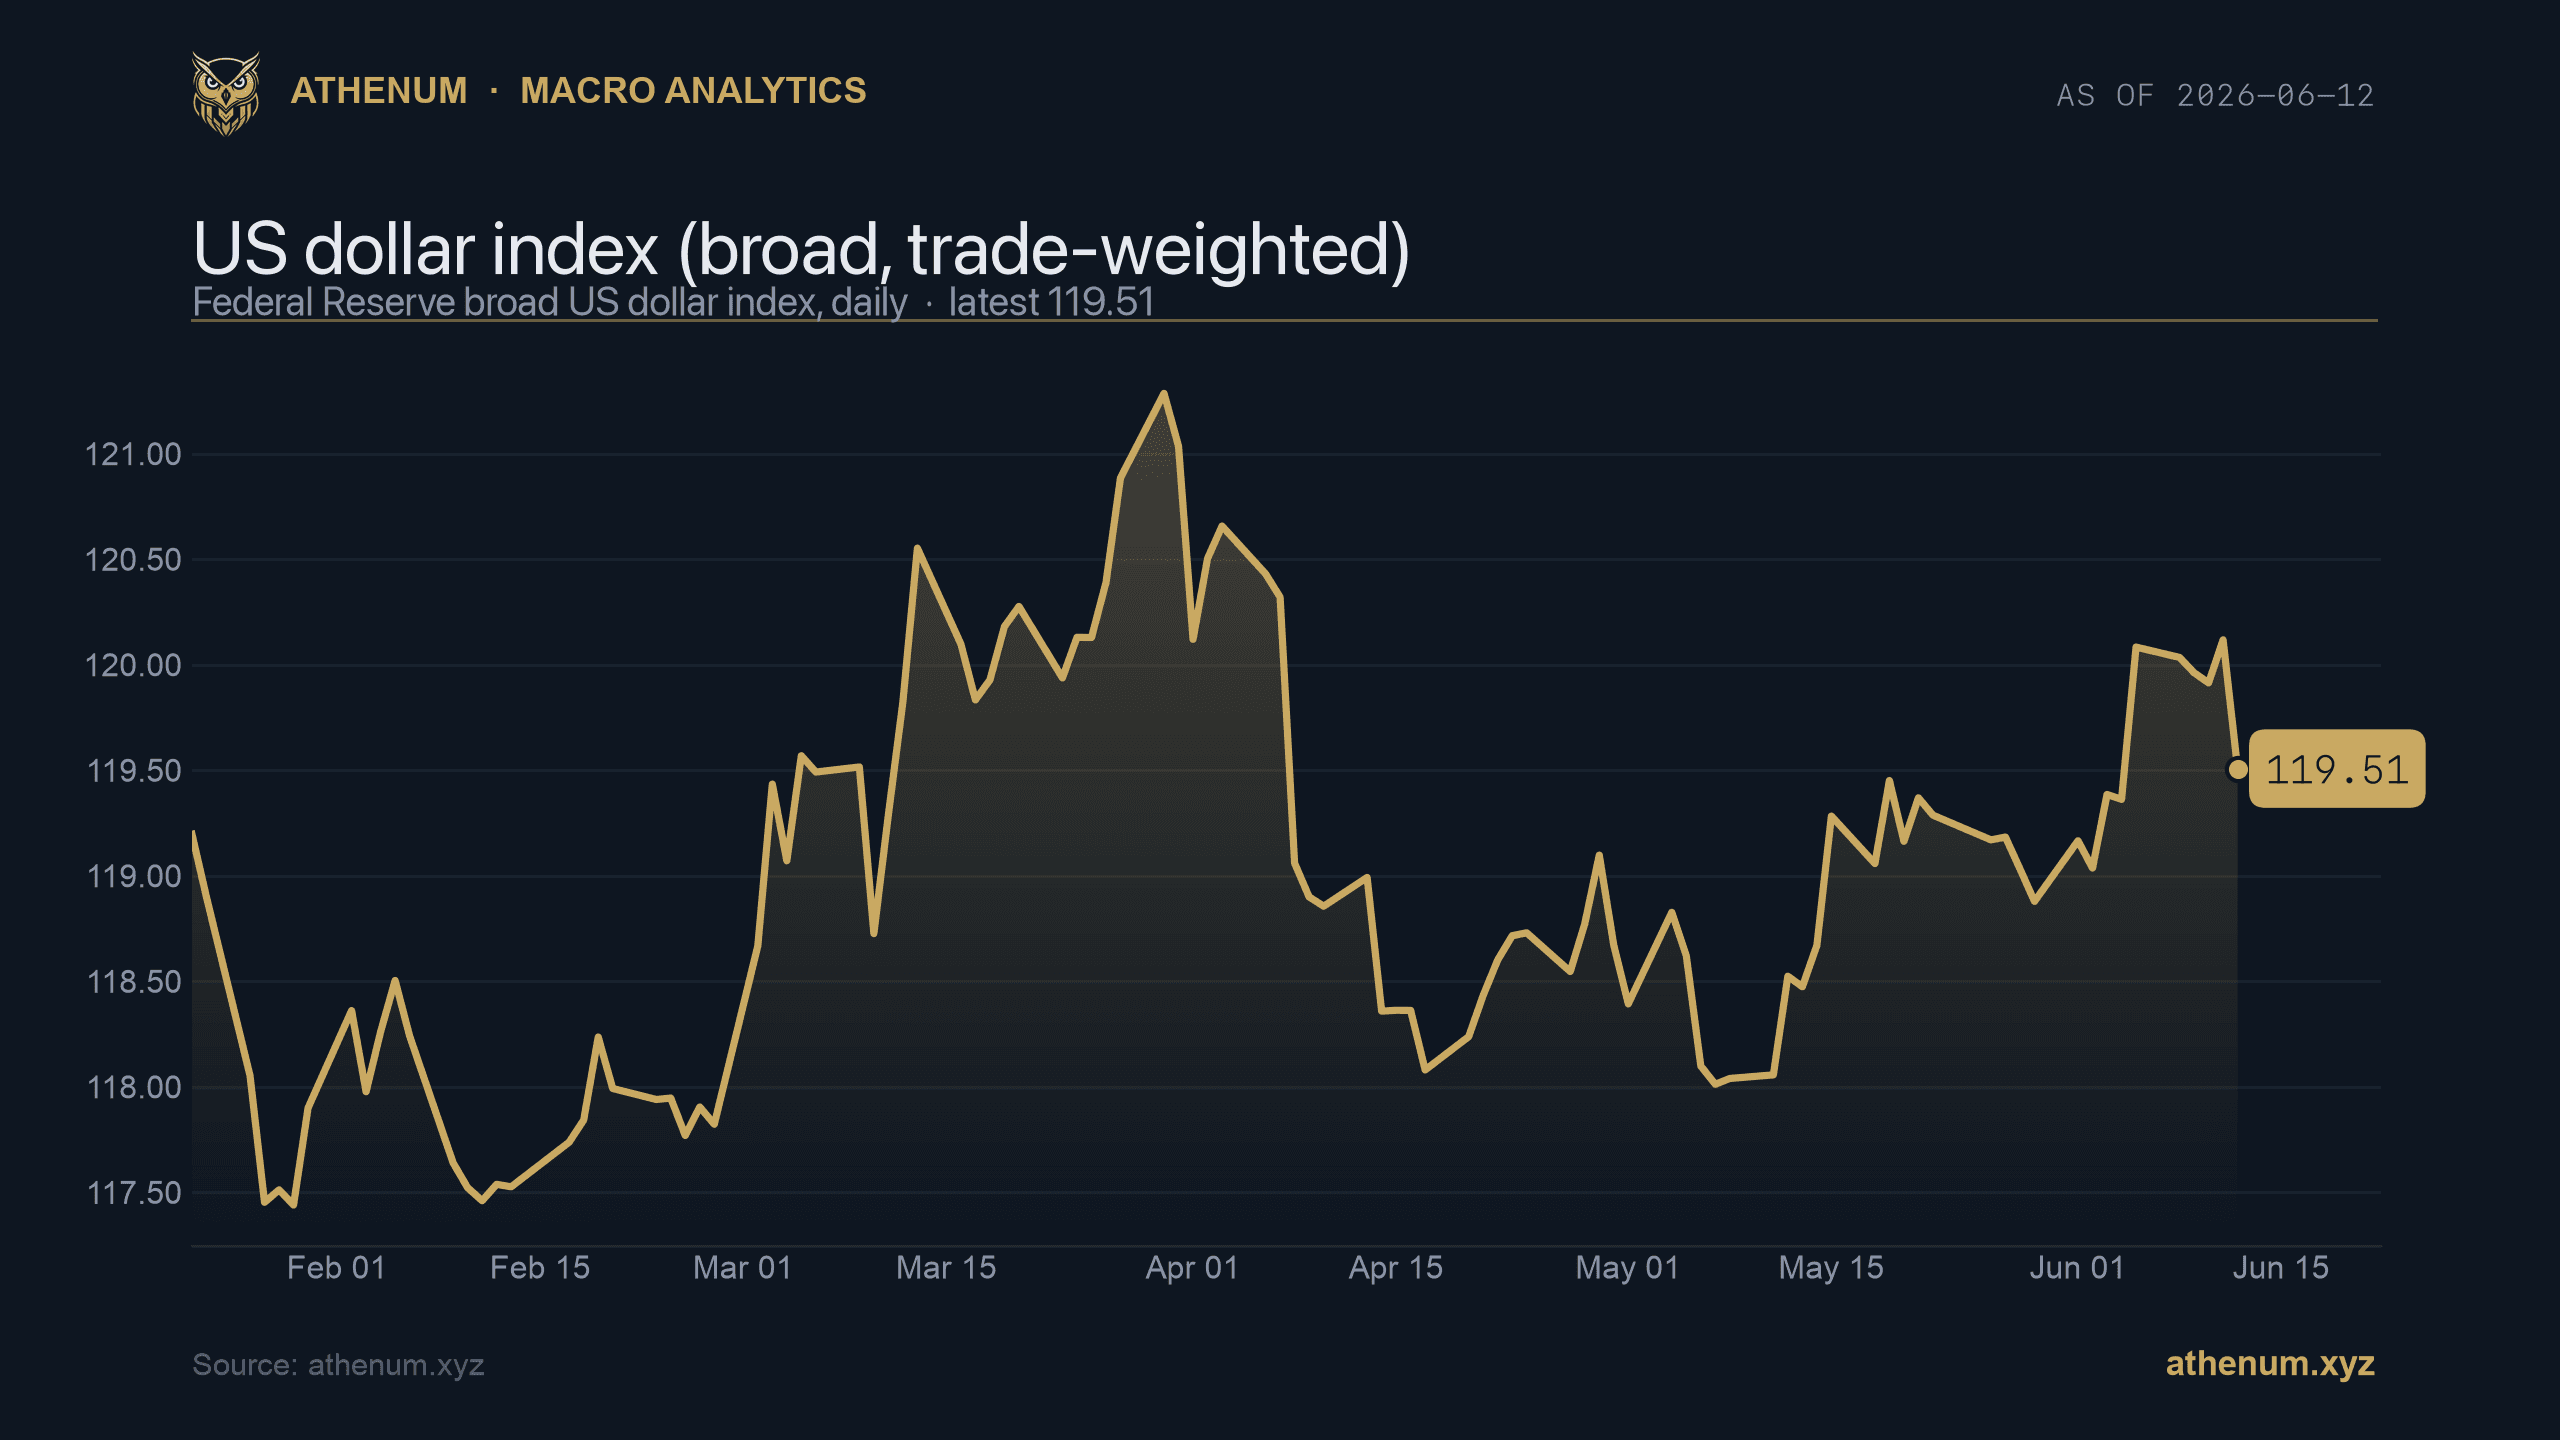
How the US Dollar Index (DXY) Shapes Crypto Risk Appetite
The US Dollar Index is a financial-conditions backdrop for crypto, but the inverse correlation is regime-dependent and can invert. How to actually read DXY for a crypto view.
Athenum Analytics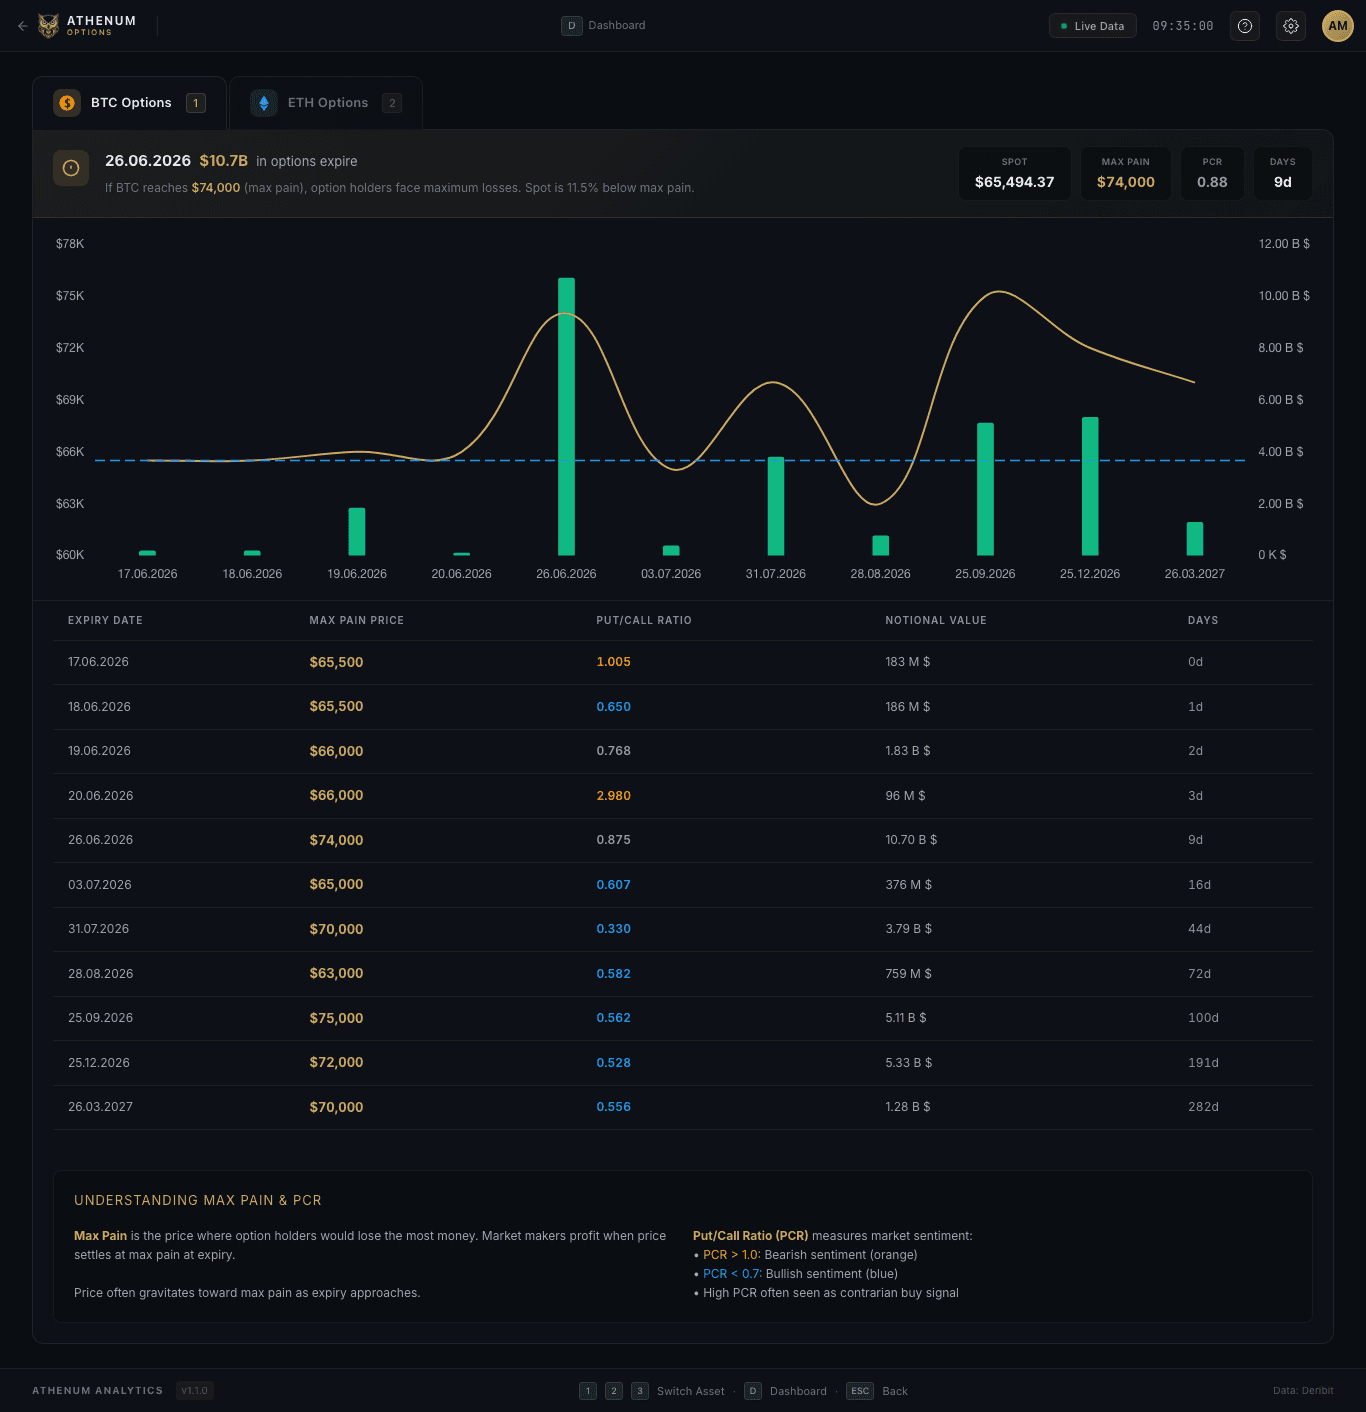
Options Skew and the 25-Delta Risk Reversal in Crypto, Explained
The 25-delta risk reversal is the implied-volatility gap between an out-of-the-money call and an out-of-the-money put at the same distance from spot.
Athenum Analytics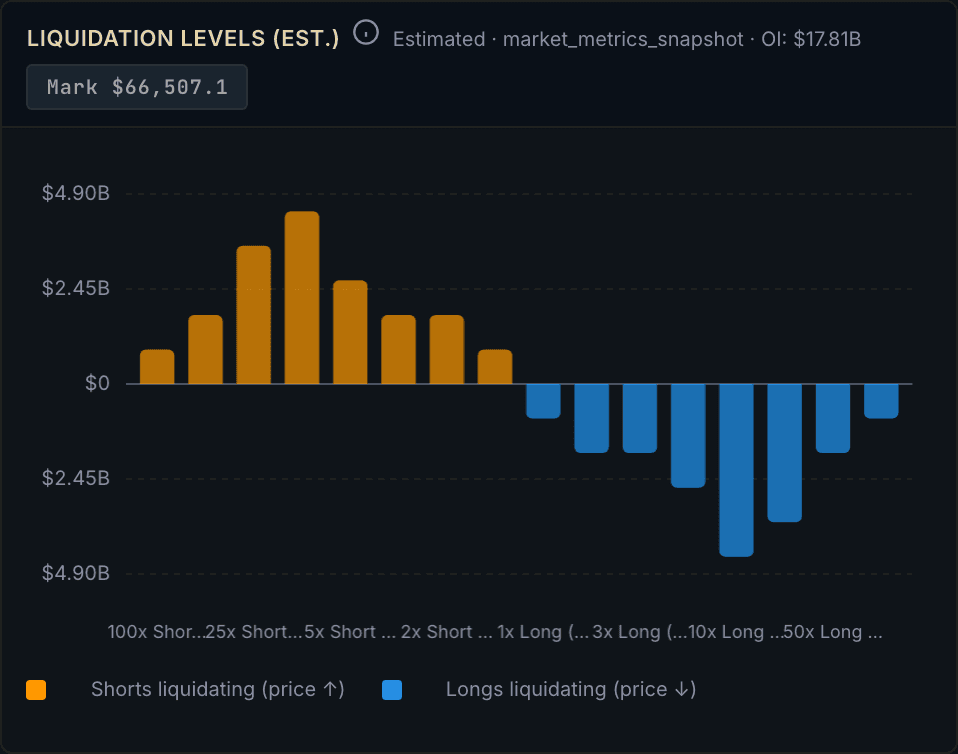
Liquidation Heatmaps: How to Read Leverage Clusters (and Their Limits)
A liquidation heatmap estimates the price levels where leveraged positions would be force-closed, and shades them by how much size is stacked there: dark for thin, bright for dense.
Athenum Analytics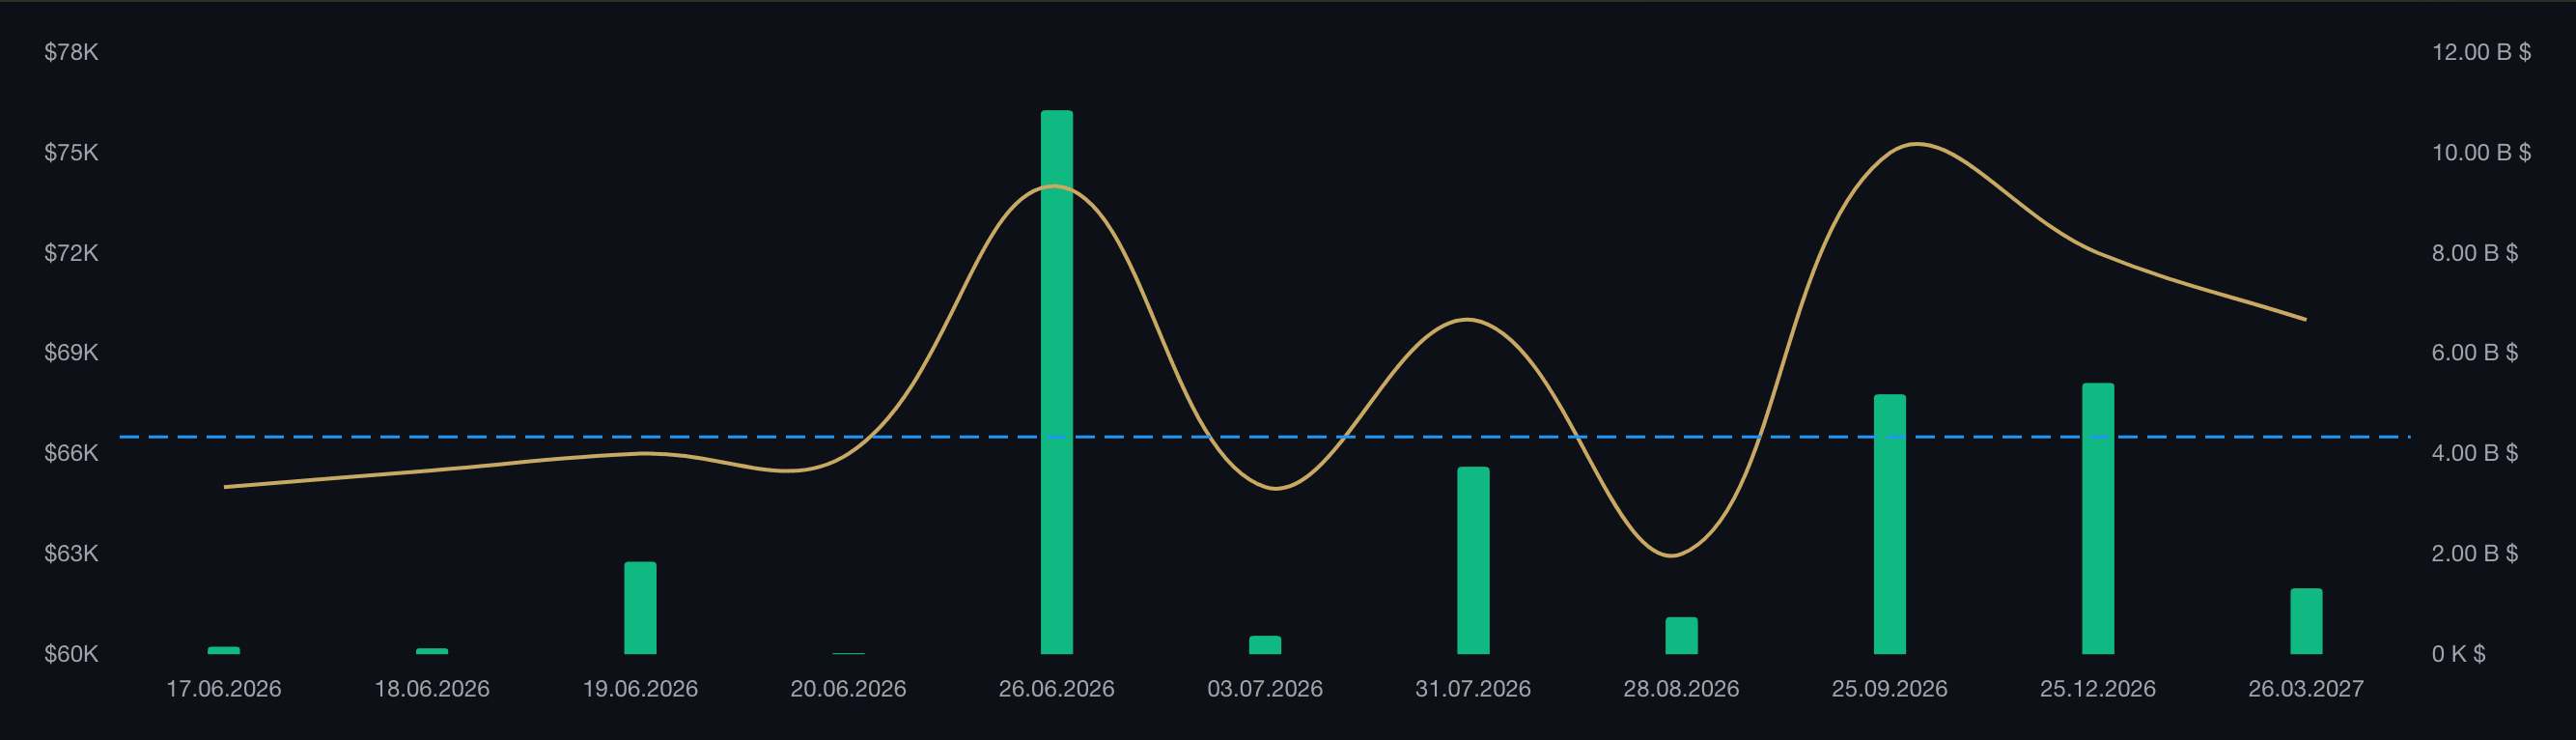
Realized vs Implied Volatility in Crypto Options
Realized volatility is how much price actually moved in the past; implied volatility is how much the options market expects it to move in the future.
Athenum Analytics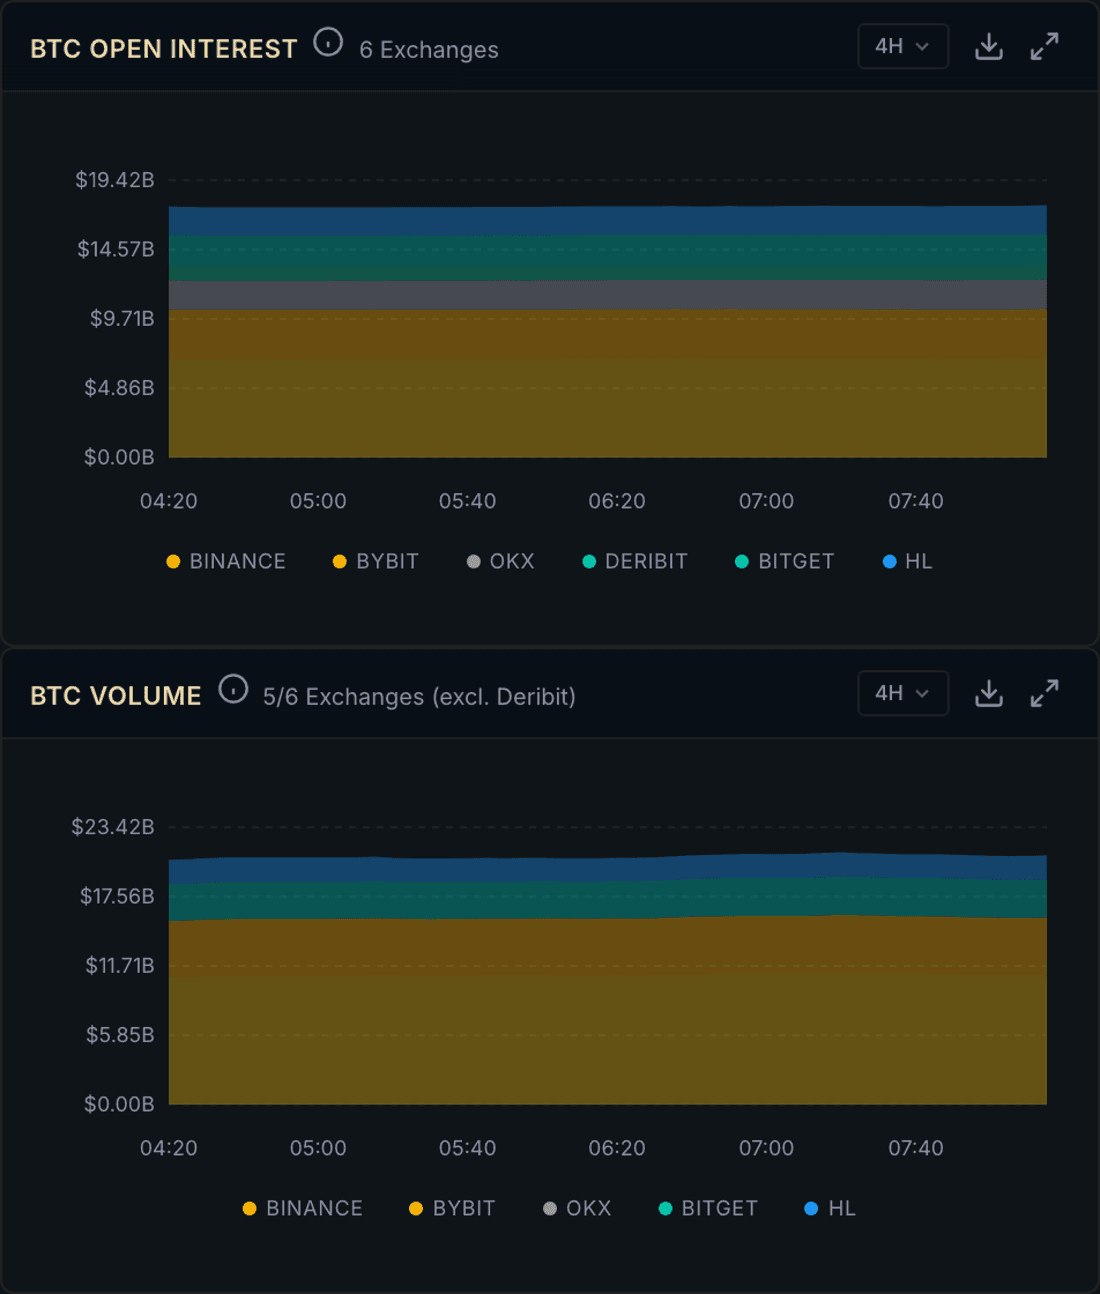
Open Interest vs Volume: What Each Signal Really Tells You
Volume counts how many contracts changed hands over a period and resets each day; open interest counts how many contracts are still open right now and carries over.
Athenum Analytics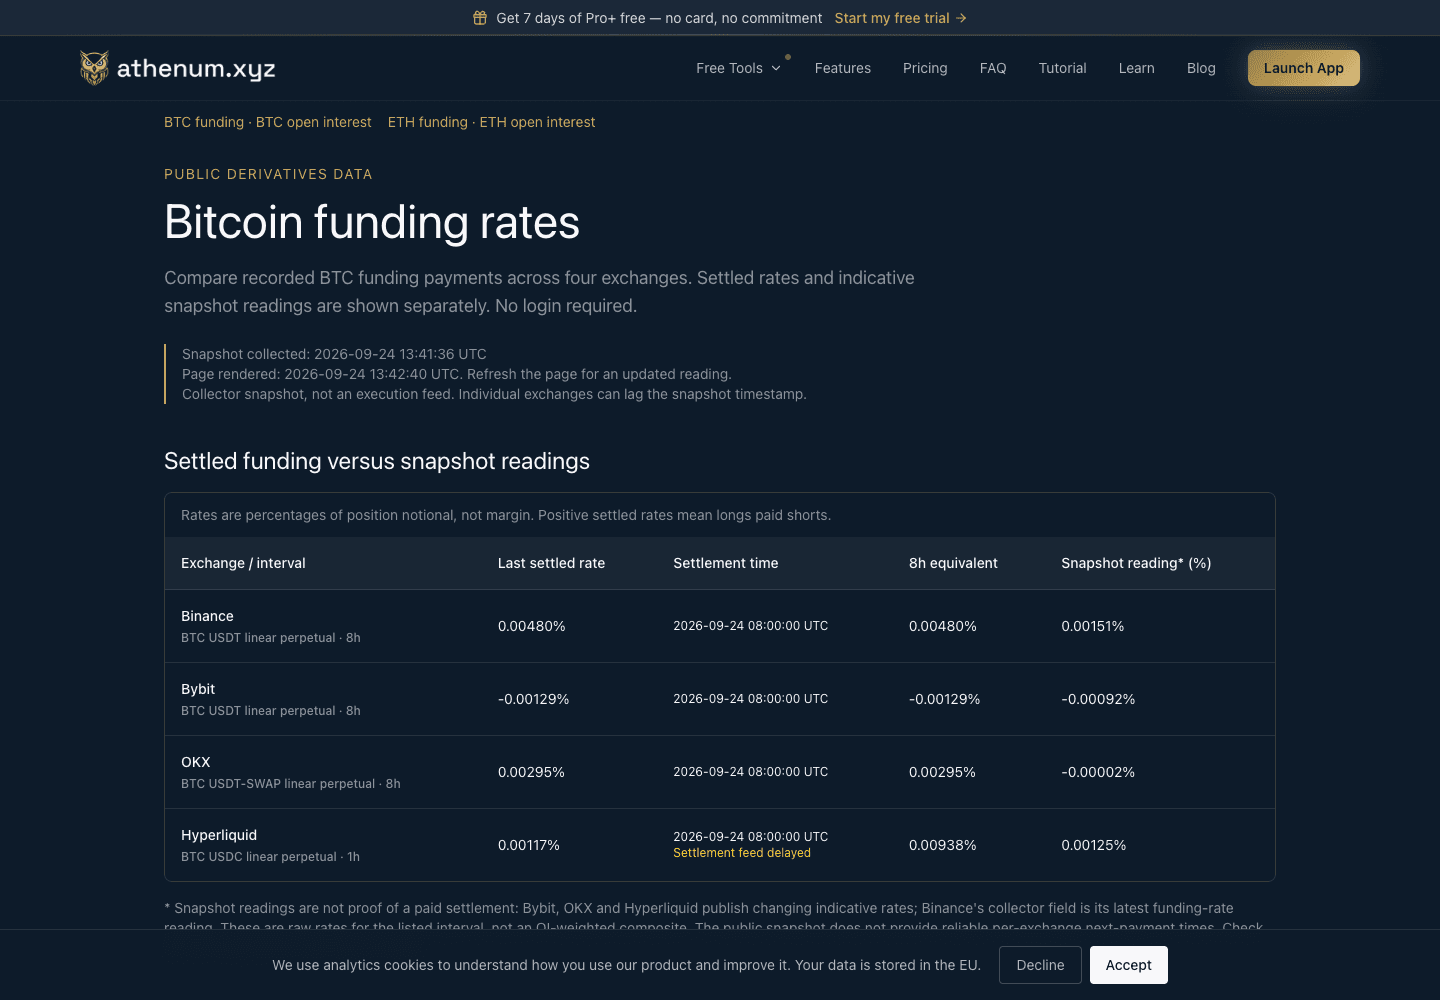
CoinGlass alternatives in 2026: free dashboards, paid tools and APIs
Checked 24 September 2026. A free chart, an ad-free subscription and an API subscription solve different jobs. This comparison separates them. Athenum publishes this article and is one of the products compared; this is not an independent vendor ranking.
Athenum Analytics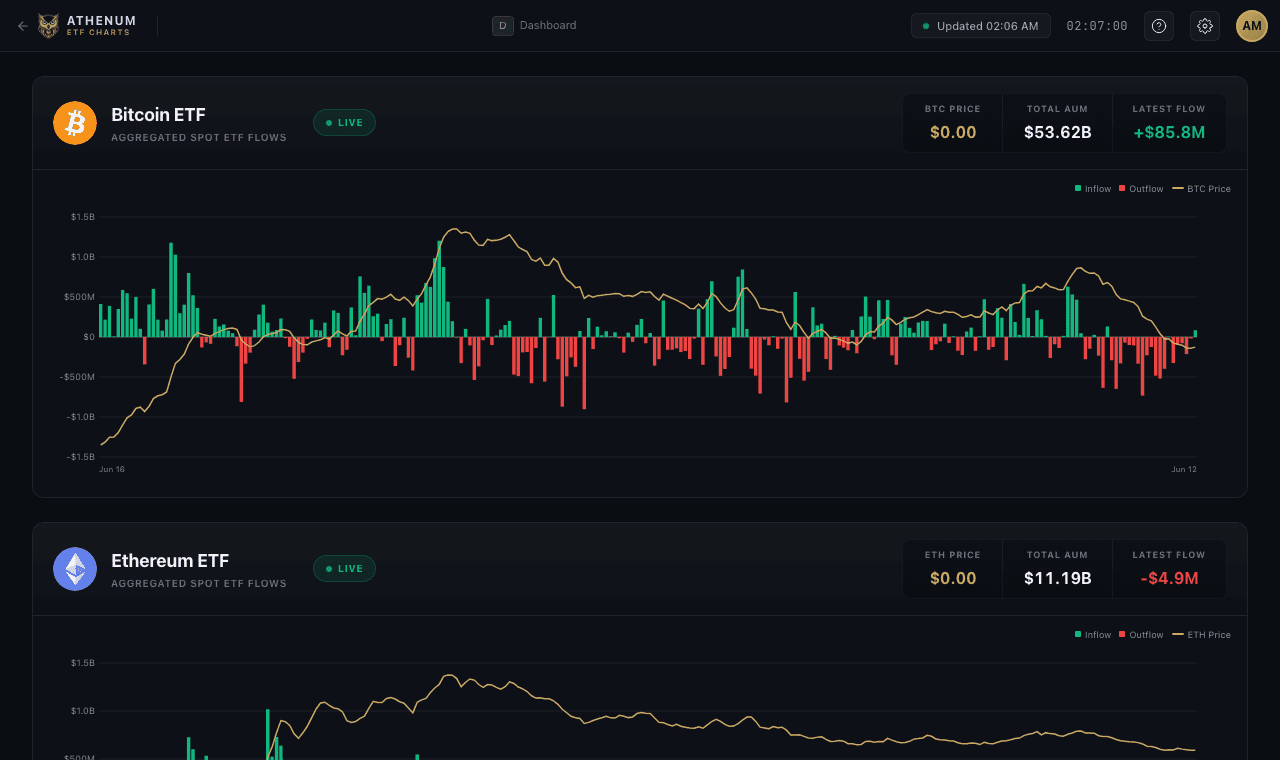
ETF Flows vs Funding Rate: What the Two Signals Say Together
Read spot ETF net flows and perpetual funding as a pair: when they agree, they confirm a move; when they split, they warn. ETF inflows with rising positive funding signal…
Athenum Analytics