Trading journal: costs, decisions and honest performance · 4 / 4
Trading account returns: remove deposits and withdrawals from performance
A larger account does not necessarily mean profitable trading: money may have been deposited. Split the period at external cash flows and link the investment returns so contributions are not mistaken for strategy performance.
Athenum7 minUpdated:
Identify external and internal cash movements
A deposit from outside the measured portfolio is an external flow; buying an asset within it is not. A transfer between two accounts inside the same portfolio boundary is internal, while the same transfer is external when measuring only one account. Define the boundary before classifying transactions.
Fees and funding charges attributable to trading are investment costs, not external withdrawals to remove from the return. Reclassifying them as contributions or withdrawals overstates performance. Preserve timestamps and values in a common reporting currency, including a documented conversion for non-cash transfers.
Link subperiod wealth factors
When accurate valuations are available immediately before and after every external flow, calculate each subperiod return from investment-value change excluding that boundary flow. Multiply the subperiod factors and subtract one. This is the time-weighted construction used here; it differs from an investor’s money-weighted return, which depends on contribution timing and size.
If precise boundary valuations are unavailable, an estimate requires a declared method and timing assumptions. Do not present an endpoint shortcut as an exact cash-flow-adjusted return. A daily equity series with a midday deposit may need a valuation at that deposit to isolate the two investment subperiods.
Worked example: the account grows while the strategy loses
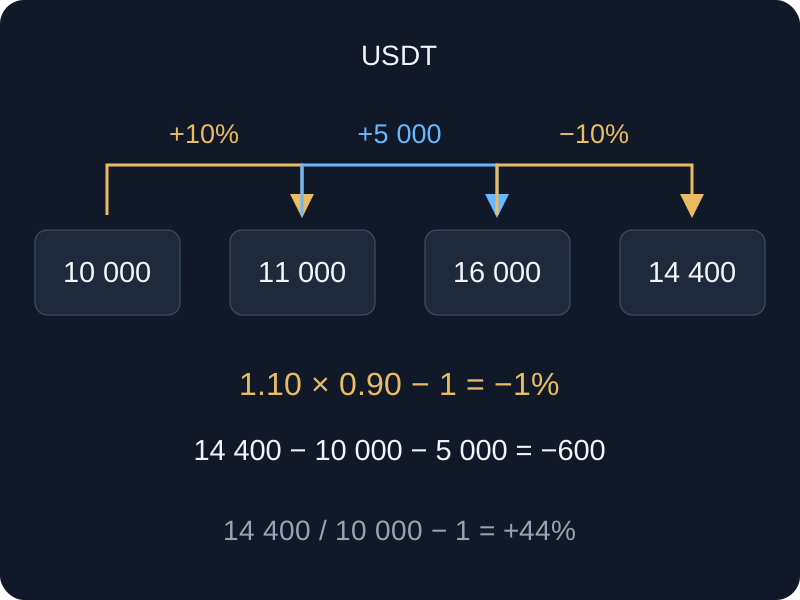
A hypothetical account starts at 10,000 USDT and earns 10%, reaching 11,000 immediately before a 5,000 deposit. It then starts the next subperiod at 16,000 and loses 10%, ending at 14,400. The raw balance grew 44% from the initial 10,000, but this includes the contribution.
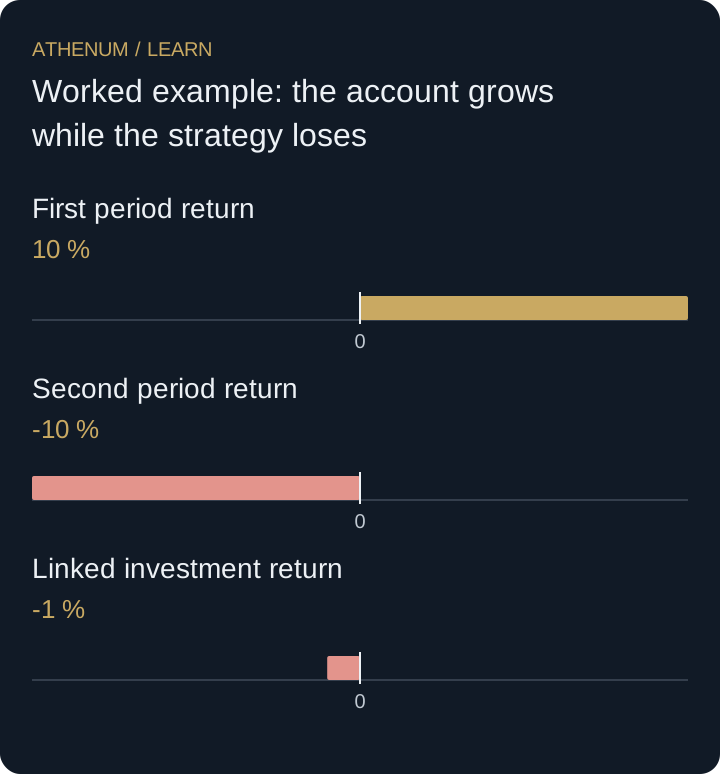
Linked investment return is 1.10 × 0.90 − 1 = −1%. Net currency P&L is 14,400 − 10,000 − 5,000 = −600. Dividing −600 by the initial 10,000 gives −6%, which is neither the linked time-weighted return nor a timing-aware money-weighted return. The differing figures answer different questions.
| Stage | Equity before event | External flow | Equity after event | Investment return |
|---|---|---|---|---|
| First investment period | 10,000 | 0 | 11,000 | +10% |
| Deposit boundary | 11,000 | +5,000 | 16,000 | Not an investment return |
| Second investment period | 16,000 | 0 | 14,400 | −10% |
 Open full-size diagram
- First period return: 10 %
- Second period return: -10 %
- Linked investment return: -1 %
Do not remove costs as if they were withdrawals
If the second period includes a 100-USDT trading fee, that fee remains part of the net investment result. Calling it an external withdrawal would improve the reported return without improving the strategy. Reconcile the ledger with actual balance changes and separately display fees for explanation.
Before acting
- Define the portfolio boundary.
- Classify deposits and withdrawals separately from trading costs.
- Value the portfolio at external-flow boundaries.
- Report linked returns, currency P&L and raw balance change with clear labels.
Check your understanding
An account rises from 8,000 to 8,800, withdraws 2,000, then grows from 6,800 to 7,140. What is the linked investment return and total currency P&L?
Show the explained answer
The subperiod returns are 10% and 5%, so linked return is 1.10 × 1.05 − 1 = 15.5%. Currency P&L is ending 7,140 plus withdrawal 2,000 minus starting 8,000 = 1,140. The lower ending account balance does not imply a trading loss.