Portfolio risk: drawdown, sizing and daily limits · 3 / 5
Portfolio heat: add correlated positions before sizing a new trade
Three positions can share one market driver. Portfolio heat adds their planned losses under a stated stop scenario; a joint stress test asks what happens if correlated moves and worse fills occur together. Use both before admitting a new position.
Athenum7 minUpdated:
Add cash exposure before interpreting correlation
For each position, calculate the loss from its current decision reference to its modeled exit, including fees and slippage allowances. Express all losses in one account currency. Their sum divided by current equity is the declared portfolio heat. If you instead measure risk from each original entry, label that convention and do not mix it with current-equity risk.
Historical correlation describes a sample of returns, at a specified interval and over a specified window. It does not say that future stop events are independent or that a low historical correlation prevents a common shock. Two positively correlated long positions may lose together; a long and short can still have basis, size and venue mismatches.
Keep the stress scenario separate from the stop budget
A joint-shock scenario supplies a possible price move and executable loss for every position. It is not a probability forecast or a value-at-risk estimate. Include collateral revaluation and other liabilities only in the relevant account model; avoid counting the same collateral loss twice.
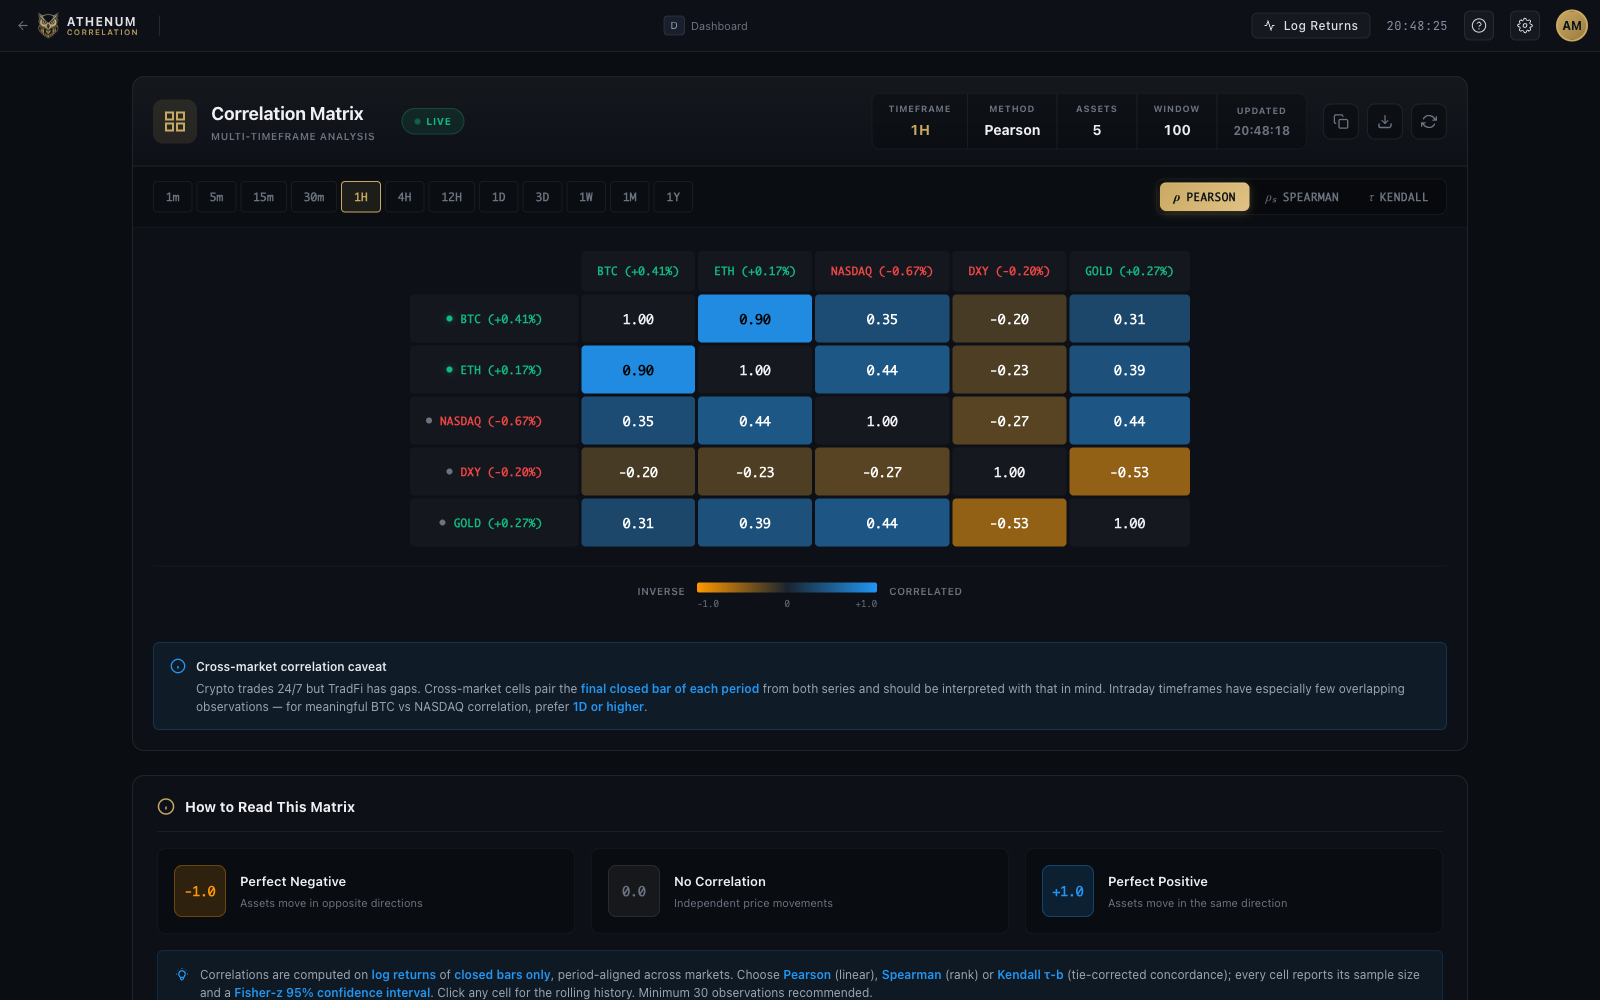
An Athenum correlation view can help identify relationships to investigate, but the matrix is not an admission rule. Record symbols, venues, return interval, window and missing data. Then construct at least one scenario in which historical diversification is weaker and stops fill beyond their intended prices.
Worked example: a fourth trade exceeds the combined allowance
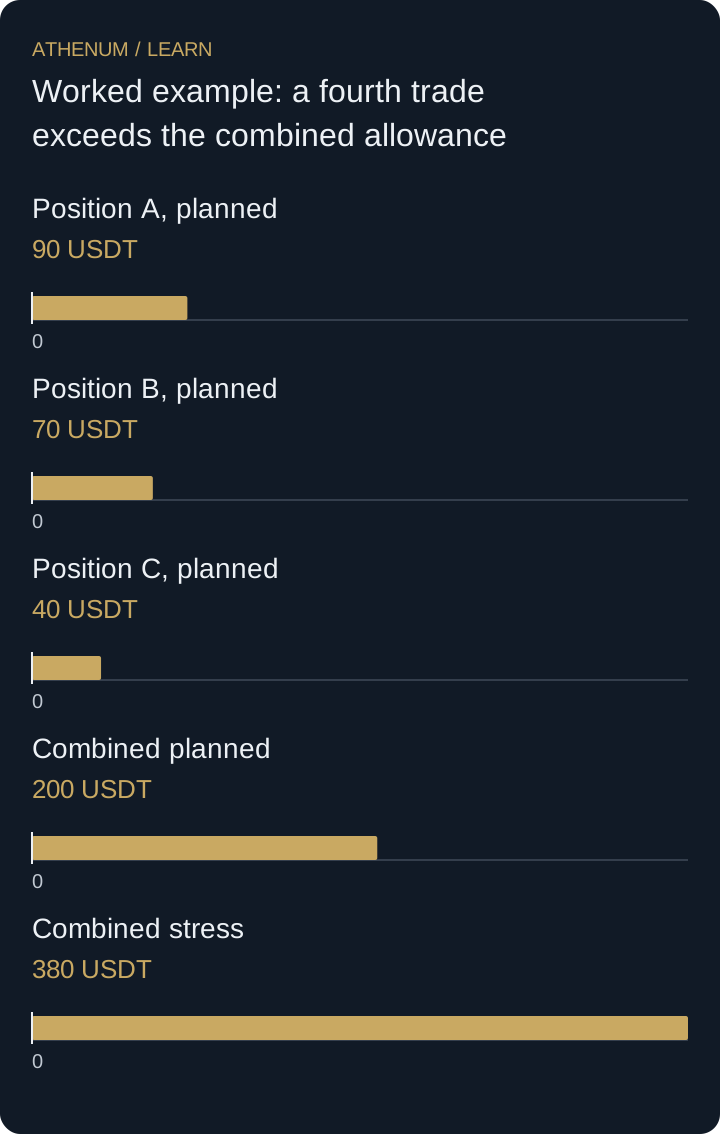
A hypothetical 10,000-USDT account holds three linear long positions. Their modeled losses from current marks, including cost allowances, are 90, 70 and 40 USDT: 200 in total, or 2% heat. A proposed fourth trade adds 80, bringing heat to 2.8%. If the predeclared combined cap is 2.5%, only 50 USDT of additional modeled loss fits.
A separate common-shock scenario produces losses of 150, 130 and 100 on the existing positions, totaling 380 or 3.8% of equity. This does not change the arithmetic of the 200-USDT stop plan; it reveals that the plan is not a guaranteed maximum. Reducing the fourth trade to a 50-USDT modeled loss still requires checking its own shock exposure.
| Position | Planned loss (USDT) | Joint-shock loss (USDT) |
|---|---|---|
| A | 90 | 150 |
| B | 70 | 130 |
| C | 40 | 100 |
| Existing total | 200 | 380 |
 Open full-size diagram
- Position A, planned: 90 USDT
- Position B, planned: 70 USDT
- Position C, planned: 40 USDT
- Combined planned: 200 USDT
- Combined stress: 380 USDT
Do not subtract an uncertain hedge at full face value
A short position may offset part of a long portfolio in one scenario and fail to do so in another. Netting their stop allowances as though gains arrive precisely when needed can hide basis risk, separate margin accounts and asynchronous execution. Revalue both legs together in each scenario; only claim the offset the model actually supports.
Before acting
- Choose one equity, currency and current-versus-entry risk convention.
- Add planned cash losses across positions before admitting a new order.
- Record the interval and window behind any correlation observation.
- Calculate joint stress losses separately from the planned stop sum.
Check your understanding
Equity is 8,000 USDT and the combined planned-loss cap is 3%. Existing positions use 95, 60 and 45 USDT. Can a new 55-USDT risk fit unchanged?
Show the explained answer
The cap is 240 USDT and existing risk totals 200. Only 40 remains, so the proposed 55 would breach the cap by 15. Reducing quantity must still respect executable increments; no historical correlation coefficient makes the extra 15 disappear.