Trade management: reconcile exits, exposure and time · 3 / 5
Measure MFE and MAE without inventing realized profit
Maximum favorable excursion describes an unrealized opportunity within a defined observation series. It is not the amount the trade earned. Maximum adverse excursion has the same dependence on price source, position size and the observations you actually retained.
Athenum8 minUpdated:
Declare the observation and position model
For a fixed-size linear long, evaluate gross mark-to-exit P&L at each retained observation using Q × (P_t − E). Define sampled MFE as the larger of zero and the maximum of those values. Define sampled MAE as the larger of zero and the negative of their minimum. Here MAE is a positive loss magnitude; a chart may plot it below zero if that sign convention is explicitly stated.
Choose what P_t represents. Last trade, midpoint, best bid, mark price and a quantity-weighted bid-depth price answer different questions. For a hypothetical immediate sale of a long, enough bid depth matters. A single unit printing at a high or a small best-bid quote does not establish an exit for the whole position. Shorts require the appropriate buy-side exit observations instead.
Retain sampling and timing limits
Restrict the interval to after entry and through the actual exit. Exclude later highs and lows after the trade is flat. Missing observations make the sampled extrema incomplete; they do not prove there was no excursion between retained timestamps. Even a depth snapshot is conditional on liquidity remaining available until an order reaches matching.
Keep quantity fixed for this exercise. Once the position is partially closed or enlarged, multiplying every later price excursion by its original quantity invents exposure. A varying-position analysis must retain the inventory path and state whether it measures only open P&L or combined realized and unrealized equity. Do not compare those different statistics under one MFE label.
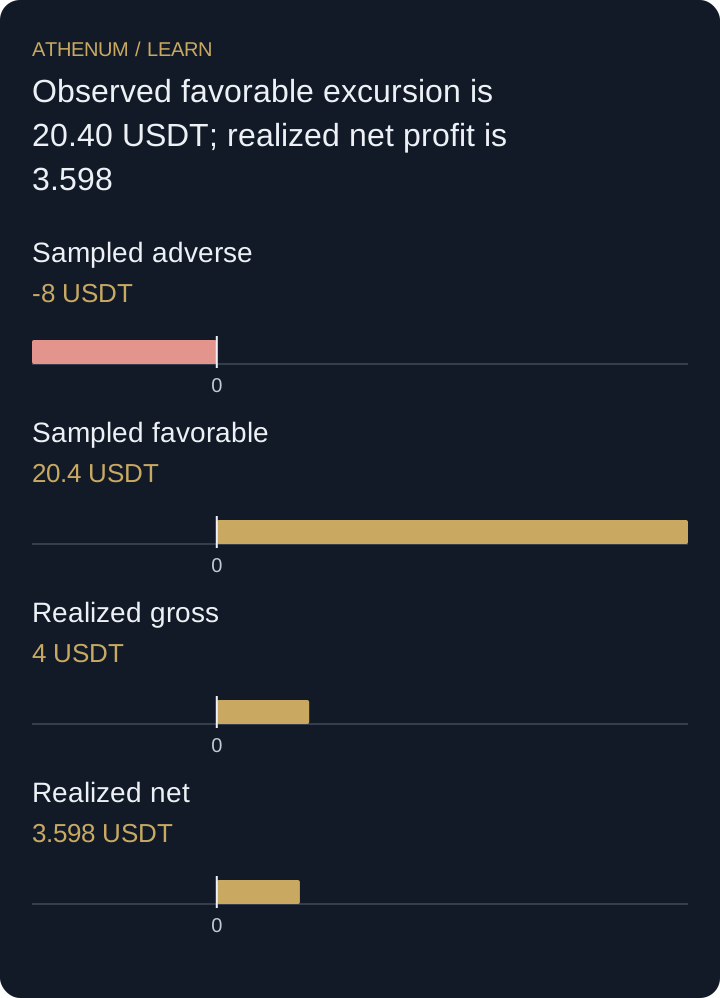
Observed favorable excursion is 20.40 USDT; realized net profit is 3.598
A hypothetical four-unit long fills at 100. Its initial stop reference is 96, so original gross price risk is 16 USDT. The following bid snapshots are retained while it is open. At the strongest observed snapshot, only two units are bid at 105.40; the next two are at 104.80. Assume no other matching or cancellation within each snapshot valuation. The four-unit depth-weighted exit price is (2 × 105.40 + 2 × 104.80) / 4 = 105.10.
The retained gross valuation series is −0.80, −8.00 and +20.40 USDT. Sampled MFE is therefore 20.40, or 1.275R; sampled MAE is 8, or 0.5R. Valuing all four units at the best bid of 105.40 would give 21.60 and overstate even this conditional snapshot value. A separate last-trade bar high of 106 would give 24, but it belongs to a different observation basis and does not establish a four-unit exit.
The actual hypothetical exit later fills all four units at 101, earning 4 USDT gross. At 0.05% per execution, fees are (400 + 404) × 0.0005 = 0.402, giving 3.598 USDT net, or 0.224875R. Funding and other charges are excluded. The quote snapshots are valuations, not extra executed exits; do not charge fees for imaginary transactions at every observation.
These are sampled extrema, not a claim to know the entire intervening market path. The final exit observation adds a gross value of 4 and changes neither sampled extreme. A chart that rises further after 09:06 is outside this trade’s observation window.
| Time UTC | Observation | Four-unit exit price | Gross P&L USDT |
|---|---|---|---|
| 09:00:01 | Bid 99.80 for at least four units | 99.80 | −0.80 |
| 09:02:00 | Bid 98.00 for at least four units | 98.00 | −8.00 |
| 09:04:00 | Two at 105.40; next two at 104.80 | 105.10 | 20.40 |
| 09:06:00 | Confirmed exit: four filled at 101.00 | 101.00 | 4.00 |
 Open full-size diagram
- Sampled adverse: -8 USDT
- Sampled favorable: 20.4 USDT
- Realized gross: 4 USDT
- Realized net: 3.598 USDT
Do not convert an observed maximum into a selectable exit
Knowing after the trade that 09:04 was the best retained observation does not mean a live rule could identify it then. An exit rule developed from these extrema needs a separate later evaluation with its own executable trigger and fills. Increasing the number of snapshots can also change measured MFE or MAE without changing the actual trade; retain sampling coverage when comparing journal entries.
Before acting
- State price source, quantity, interval and gross or net convention.
- Use sufficient depth for the declared hypothetical exit quantity.
- Distinguish sampled extrema from a complete continuous path.
- Stop the observation window when the position is flat.
- Compare actual fills with excursions without inventing a hindsight exit.
Check your understanding
Add a previously missing 09:03 snapshot with enough bid quantity for four units at 96.50. The actual fills and fees remain unchanged. What happens to sampled MAE, sampled MFE and realized net P&L?
Show the explained answer
The added valuation is 4 × (96.50 − 100) = −14 USDT, so sampled MAE rises from 8 to 14, or from 0.5R to 0.875R. Sampled MFE stays 20.40 USDT and realized net P&L stays 3.598. Better observation coverage changes an excursion statistic, not the recorded executions.