Table of Contents6 sections
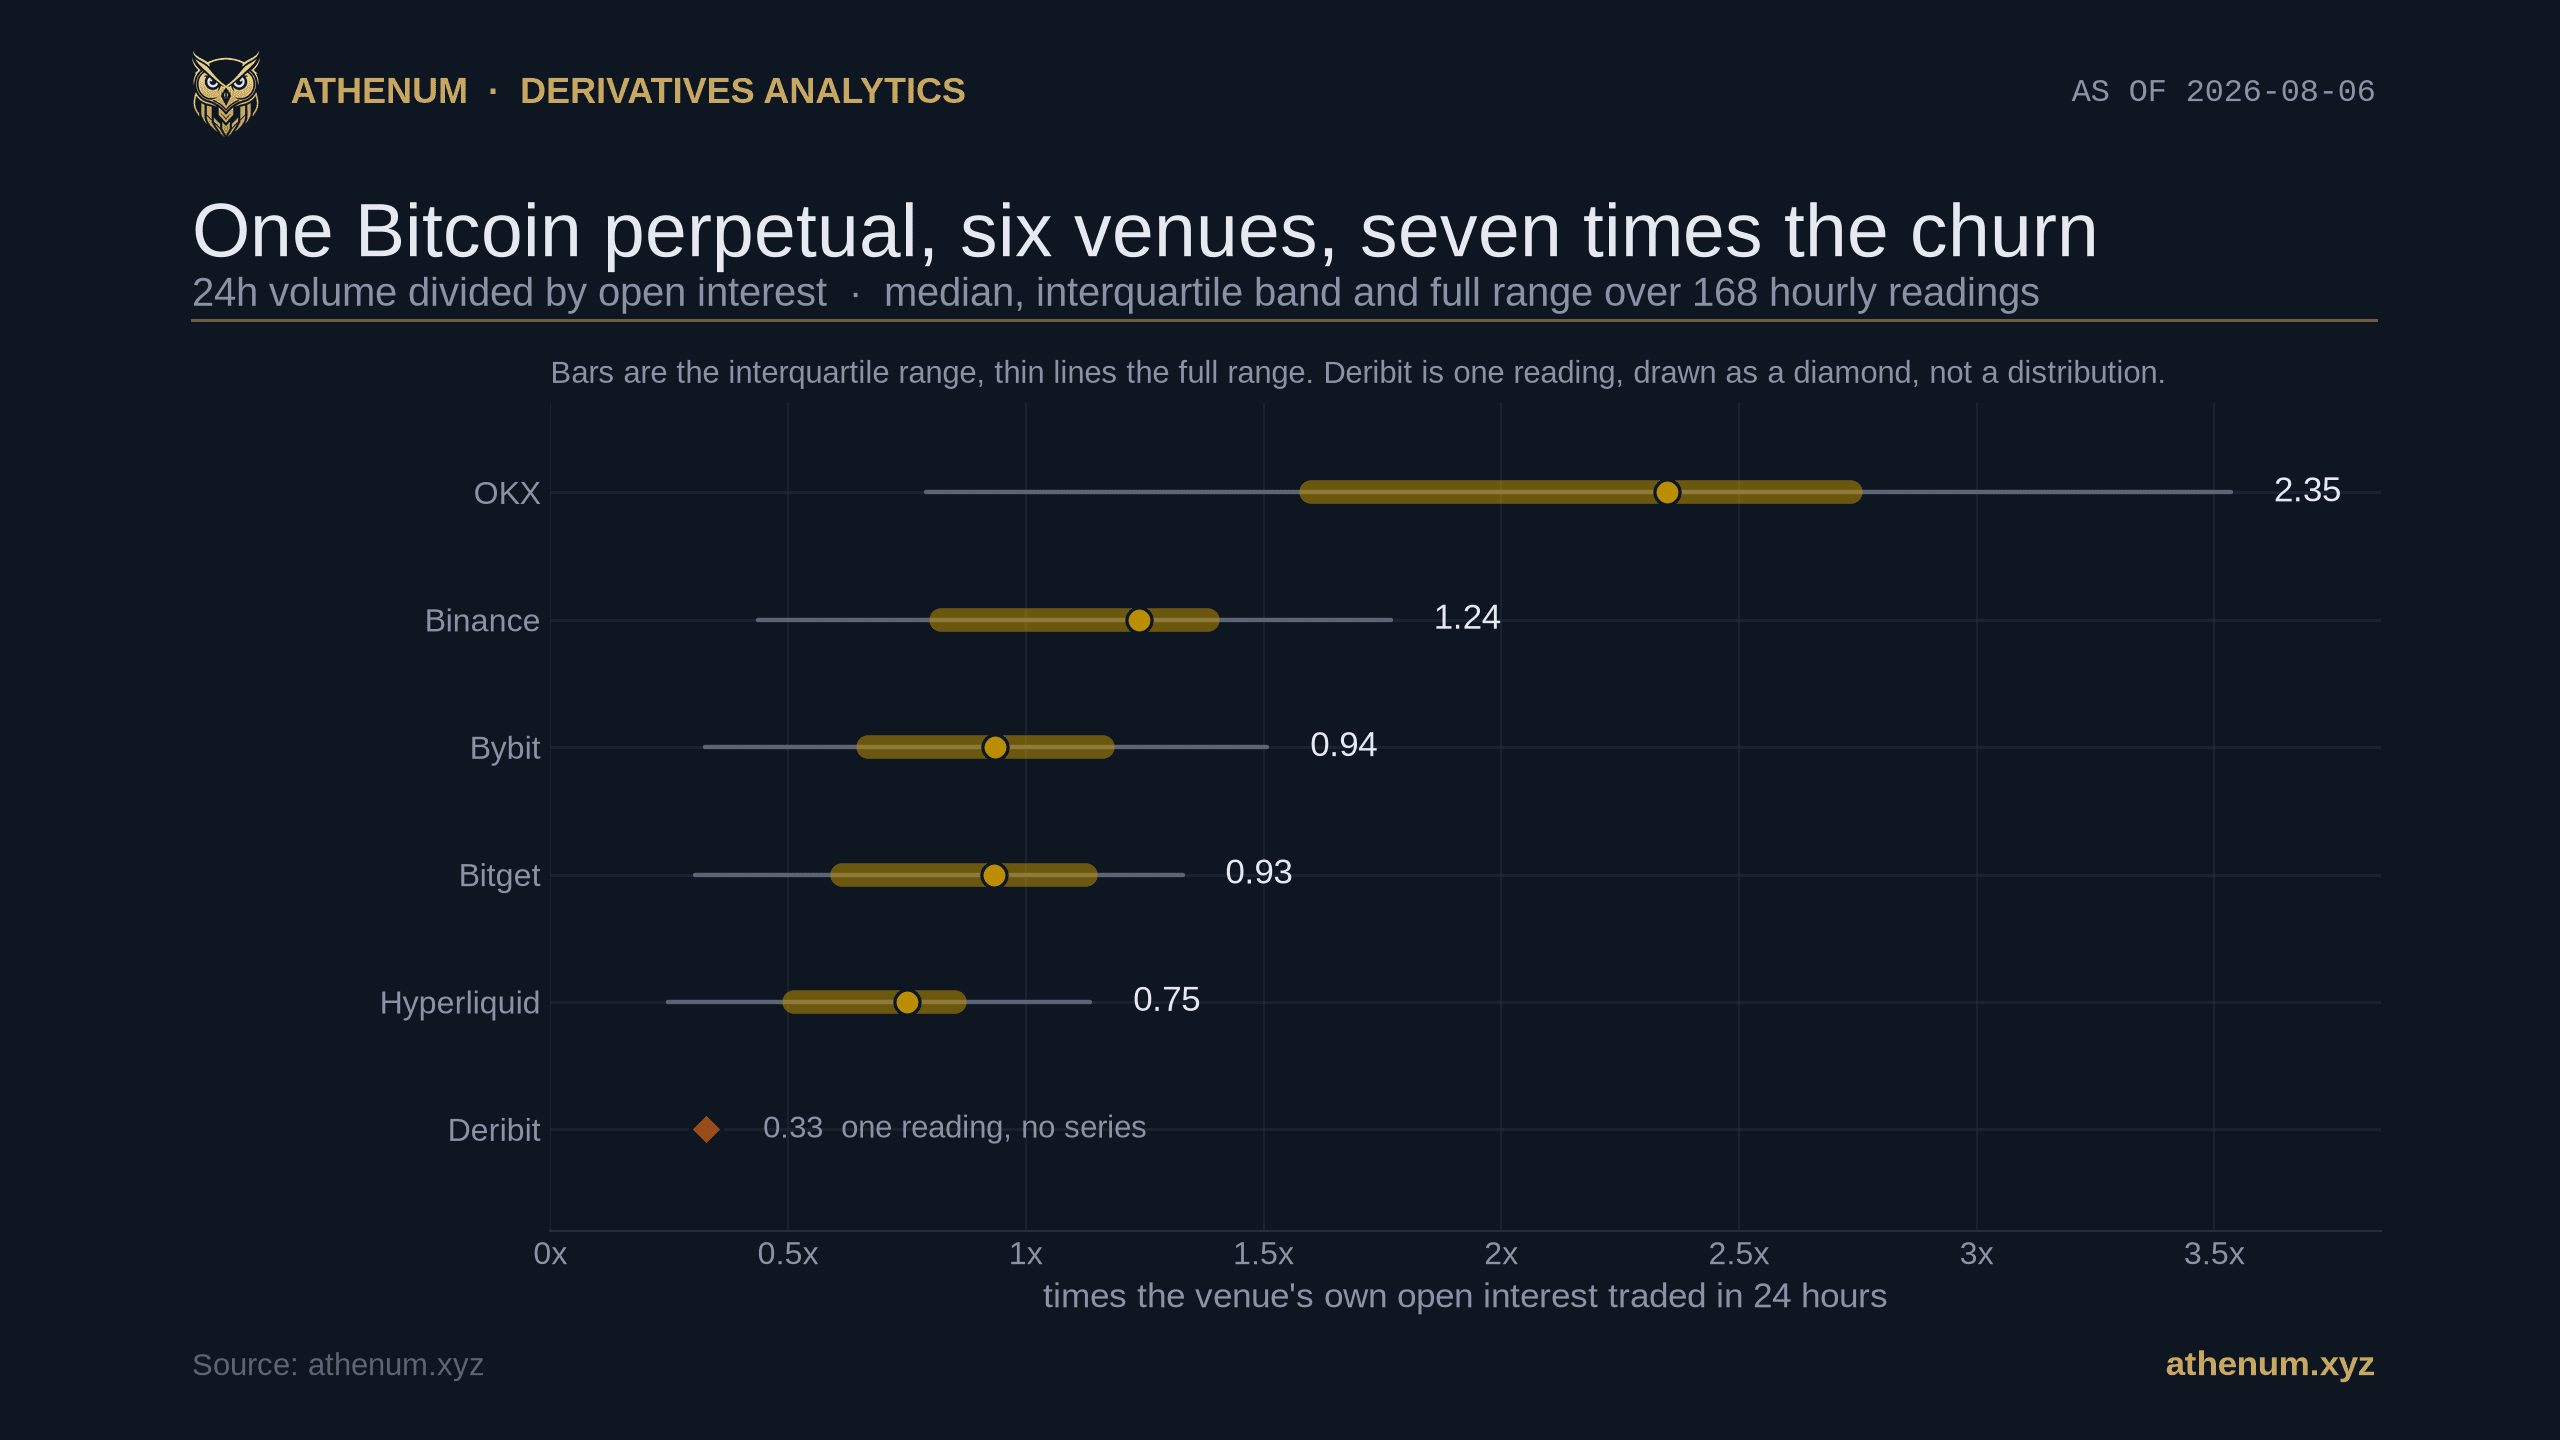
TLDR. Bitcoin perp turnover is one division: the notional a venue traded in 24 hours divided by the open interest still sitting on its book. On 2026-08-06, read anonymously from each venue's own public endpoint at 08:47 UTC with Bitcoin near $64,850, OKX traded $4.73B against $2.02B of open interest, a turnover of 2.34, while Hyperliquid traded $1.60B against $2.33B, a turnover of 0.69. Binance sat between them at $8.20B against $6.93B, or 1.18. Across 168 hourly readings between 2026-07-29 12:00 UTC and 2026-08-06 08:00 UTC the medians are 2.35 for OKX, 1.24 for Binance, 0.94 for Bybit, 0.93 for Bitget and 0.75 for Hyperliquid, and OKX sat above every other venue in 168 of 168 hours. Read as time, the same numbers say OKX trades notional equal to its whole open book about every 10 hours and Hyperliquid about every 32. Two of these venues publish or document an open interest figure that counts both sides of every contract; put both on one side and OKX still leads in 168 of 168 hours, while Bybit at 1.87 and Bitget at 1.86 stay impossible to separate.
How many times a day does each venue trade its own open interest?
Between roughly two and a third of a time, depending entirely on which venue you ask. Turnover here is 24 hour traded notional divided by open interest, both in dollars, both taken from the same venue at the same moment, so the ratio never mixes one exchange's numerator with another's denominator. These are the readings from each venue's own public endpoint, each pulled anonymously at a single instant, 2026-08-06 08:47 UTC:
Venue | 24h volume | Open interest | Turnover | Hours to trade the whole book |
|---|---|---|---|---|
OKX | $4.73B | $2.02B | 2.34 | 10 |
Binance | $8.20B | $6.93B | 1.18 | 20 |
Bybit (default field) | $3.61B | $3.96B | 0.91 | 26 |
Bitget | $2.19B | $2.46B | 0.89 | 27 |
Hyperliquid | $1.60B | $2.33B | 0.69 | 35 |
Deribit | $0.24B | $0.73B | 0.33 | 73 |
Those six rows are one instant. Every median and band quoted below comes from the 168 hourly readings instead, so the two sets of figures differ slightly by construction and are labelled throughout.
The largest venue by volume is not the fastest venue by turnover, and that is the first useful thing this ratio does. Binance traded more Bitcoin perpetual notional than any other venue in the table and still turns its book over more slowly than OKX, because it is carrying about 3.4 times OKX's open interest while trading 1.7 times OKX's volume. Size of flow and speed of flow are different measurements, and only one of them is on the front page of most dashboards. It is worth being sure which is which before dividing, because volume and open interest answer different questions and a ratio inherits every ambiguity in both of its inputs.
Worth being precise about what this ratio is called, because the name is not settled. No exchange or regulator defines it: the CFTC and CME publish volume and open interest as two separate series and never divide them. In academic work the same quantity is the speculation ratio, written as volume over open interest by Garcia, Leuthold and Zapata in 1986 and criticised at length by Lucia and Pardo in 2010, who set out the conditions under which reading it as a measure of speculative activity fails. In crypto it usually appears the other way up, as Glassnode's open interest to volume ratio. This post calls it turnover and means volume divided by open interest, and says so here because in exchange and industry usage the bare word turnover means traded volume itself.
One reading is a snapshot, so the 168 hourly readings behind it matter more than the row above. Over the window from 2026-07-29 12:00 UTC to 2026-08-06 08:00 UTC the median turnover is 2.35 for OKX, 1.24 for Binance, 0.94 for Bybit, 0.93 for Bitget and 0.75 for Hyperliquid. That window has a hole, and it is the same one an earlier post on this data disclosed: 21 hourly readings are missing across a 22 hour break from 2026-07-31 03:00 UTC to 2026-08-01 01:00 UTC, so everything here is computed on the 168 readings that exist rather than on the 189 the window nominally holds. The spread inside each venue is wide, which is exactly what you would expect from a ratio whose numerator is a rolling day of flow: OKX's middle half of readings runs from 1.60 to 2.74 and its full range from 0.79 to 3.54, while Hyperliquid's middle half runs from 0.51 to 0.85. A single hour taken from either venue can therefore land far from that venue's own median, and quoting one hour as if it were the level is the easiest way to get this wrong.
What does a turnover of 2.35 actually mean?
It means the venue trades notional equal to its entire open position base roughly every 10 hours, and that is a statement about the venue, not about any trader on it. Divide 24 by the turnover and you get the time the venue needs to match volume equal to everything currently open: about 10 hours for OKX, 19 for Binance, 26 for Bybit and Bitget, 32 for Hyperliquid, and about 73 for Deribit's perpetual on its single reading.

The same medians expressed as time: 24 divided by the turnover ratio. Bybit and Bitget both round to 26 hours, which is the first sign that the two cannot be told apart.
Be strict about what that number is not. It is not the average holding period of a position, and no public feed can measure that, because a venue publishes the size of its book and the size of its flow but never the identity of who opened and who closed. Some of every venue's volume is market makers passing inventory between each other without any end user changing their view, and that volume inflates the numerator without any position being rotated. So the honest reading of "10 hours" is a floor on how long the average dollar of open interest survives, not an estimate of it. The direction of that bias is fixed, which is what makes the floor usable: intermediation can only make the measured turnover higher than true position rotation, never lower.
There is a second thing the phrase hides, and it is worth stating because it cuts against the intuition the number invites. This is throughput divided by inventory, and it does not say that the open interest itself is what gets traded. A venue where one heavily traded contract accounts for most of the volume while the rest of the book sits untouched produces exactly the same ratio as a venue where every position is genuinely rotated. The arithmetic gives an aggregate rate, not a sampling claim about which positions moved.
The other thing turnover is not is a ranking of liquidity. A venue can turn its book over quickly because traders there hold for hours rather than days, or because its book is thin relative to its flow, or because its contract is small enough that the same exposure takes more trades to build. OKX's contract is 0.01 BTC, about $649 at the price above and the smallest clip in this group, which mechanically supports more and smaller fills for the same economic activity. Those are different markets with the same ratio, and separating them needs depth data and contract specifications, not this division.
Which of these venue differences are real?
Three of the four adjacent gaps hold in essentially every hour, and one does not exist. Because the same ratio is computed on all 168 hourly readings, each pair can be tested directly rather than ranked from a single snapshot: subtract one venue's hourly turnover from another's and count how often the difference keeps its sign.

Hourly differences with their interquartile bands and full ranges. Three pairs never change sign in a way that matters; Bybit minus Bitget crosses zero and holds in only 129 of 168 hours, so the two are reported as a tie.
OKX sat above Binance in 168 of 168 hours. Binance sat above Bybit in 168 of 168 on the venues' default fields. Bitget sat above Hyperliquid in 167 of 168, so that one has a single exception and should be quoted with it. Bybit sat above Bitget in 129 of 168, which is not an ordering. It is a tilt, 77 percent of the hours rather than a clean split, but a tilt is not a rank: their medians are 0.94 and 0.93, a gap of about one percent against hourly ranges that are each more than a full turn wide. Anyone publishing a league table that puts Bybit above Bitget here is reporting noise as a result, and the same table would flip on roughly one day in four.
This is the part most venue comparisons skip. A ranking with no dispersion attached is untestable by the reader, and untestable numbers are exactly what a market with no reporting standard produces most of. The two extremes in this group survive the test easily and the middle does not, and both facts belong in the same table.
Does the open interest counting convention change the answer?
It doubles the answer for two of these six venues, and both of them say so themselves. Turnover puts open interest in the denominator, so a venue that reports both sides of every contract reports a denominator twice as large as one that reports the position once, and its turnover comes out at half.
Bybit publishes both figures for the same instrument at the same instant. Read at 2026-08-06 08:47 UTC, its BTCUSDT perpetual returned 61,066.961 BTC in the default open interest field and 30,533.481 BTC in the single side field, a ratio of 2.000000 to seven figures, and its API reference labels the two in as many words as both sides and single side. Bitget states the same thing in prose rather than in a field: its own support material says platform open interest is calculated bilaterally, long plus short. So this is not one venue's quirk against five unknowns, and we said so in the post that measured the conventions one by one.
Put both of those venues on one side and the table changes in a way worth reading carefully. Bybit's median turnover goes from 0.94 to 1.87 and Bitget's from 0.93 to 1.86, each doubled on the unrounded median rather than on the two decimal figure printed here, so both jump ahead of Binance at 1.24, in 168 of 168 hours each. OKX still leads in 168 of 168. And the pair that could not be separated before cannot be separated after: Bybit stays above Bitget in exactly the same 129 of 168 hours, because scaling two series by the same factor cannot reorder them. A correction that moves two venues past a third and leaves the one genuine tie exactly where it was is the useful kind, because it tells you which part of the table was an artifact of reporting and which part was never a difference at all.

The two venues that say they count both sides, drawn twice each. Bybit goes from 0.94 to 1.87 and Bitget from 0.93 to 1.86, both passing Binance's 1.24 shown as the dotted line. Bybit publishes both fields; Bitget states the convention in prose, so the marks differ.
For the remaining four venues the convention is not something a reader can settle from the venue's own material. The practical consequence is a bound rather than a correction: any of them that counts both sides has a true turnover up to twice the figure in the table, and none can have a true turnover below it. That makes the ordering safe in one direction only, and it identifies exactly one venue that could overturn the headline. Binance is the only one whose doubled figure clears OKX, at a median of 2.48 against 2.35, and Binance's open interest field carries no description of its convention at all. Bybit, Bitget and Hyperliquid cannot reach OKX even at their upper bounds. If you want one number from this post to be sceptical of, it is not the spread, it is OKX's lead over Binance specifically.
Two further cautions belong here rather than in a footnote. The one-directional bound holds only because the volume side is single counted, which no venue documents either; we established it by reconstruction, matching each venue's 24 hour field against the sum of its own trades or minute candles, and every one came back at a ratio of 1.000, not 2. And open interest itself has been shown to be misreported: Giagkiozis and Said, publishing in Ledger in 2024, reconcile open interest against traded volume across venues and find that some of the largest derivatives exchanges systematically misquote it, with Bybit and OKX among those showing unexplained variation. A cross-venue table of this ratio is therefore measuring reporting policy as well as trader behaviour, and there is no way to fully separate the two from public data.
What can turnover not tell you?
Four things, and each of them is a way this number gets misused.
1. It cannot tell genuine churn from inflated volume. Turnover has traded volume in the numerator, so any volume that is not a real change of hands raises it, and the ratio has no way to see the difference. A high reading is consistent with an active day trading market, with a venue whose contract size is small, with a maker rebate programme that pays for round trips, and with a market whose reported volume overstates its economic activity. This measurement alone cannot choose between them, and in regulated futures a high turnover ratio is routinely attributed to rebates rather than to churn. 2. It cannot compare different instruments. The Deribit row is one Bitcoin perpetual on a venue whose main business is options: its Bitcoin options open interest is more than thirty times its perpetual book. Slow turnover on that perpetual is a fact about a small corner of that venue and should not be read as a verdict on the venue itself. The contract type matters at least as much as the venue, and that is testable inside a single venue rather than across them. Read on 2026-08-06, OKX's dollar quoted perpetual gave 2.36 while its coin margined one gave 0.42; Binance gave 1.20 against 0.67; and Deribit's own dollar quoted perpetual gave about 2.07 against the 0.33 in the table. That last book is small, about $31M of open interest, so take it as suggestive rather than settled, but the first two are not small and they point the same way. The headline pair in this post, OKX against Hyperliquid, are both dollar quoted, so that comparison is like for like; the Deribit row is not, and should be read as a fact about a contract type. 3. It cannot survive a change of scope. Every figure here is one USD quoted Bitcoin perpetual per venue, and five of the six are quoted in a dollar stablecoin rather than in dollars. Coin margined perpetuals, dated futures and every other asset sit outside them, and adding them changes the denominators far more than the differences being discussed. 4. It is not stable enough to quote to two decimals from one hour. The interquartile bands above are wide on purpose. A reader who pulls one hour and gets 1.9 for OKX has not caught us out; they have drawn one sample from a distribution whose middle half spans 1.60 to 2.74.
How do you check this yourself?
Pull two fields from one venue and divide. Every number above comes from a public endpoint that needs no account: the 24 hour volume field and the open interest field of the same instrument on the same exchange, taken within seconds of each other. The discipline that matters is not the arithmetic, it is refusing to cross venues inside the ratio, and refusing to draw a conclusion from a single hour when the ratio's own range is this wide.
Then check the units before you divide, because they are the most common way this goes wrong. One venue publishes its swap volume in the base coin while the others publish theirs in dollars, so a straight comparison of the raw fields makes that venue look about 65,000 times smaller than it is. Another publishes an inverse contract whose open interest is quoted in dollars of notional rather than in coins. Neither of those is a subtlety; both are the difference between a sensible table and a nonsense one, and neither is visible in the field name.
If you want the position level arithmetic under these aggregates, Athenum's free liquidation calculator takes one position end to end and the leverage calculator handles the margin side. For the surrounding ideas, open interest by exchange shows how the venue mix in the denominator moves over longer windows, the perp to spot volume ratio applies the same style of division to a different pair of numbers, and why reported liquidation figures are a floor is the same lesson applied to a number nobody publishes in full.
Each venue figure above is that exchange's own public number, and the 168 hour window around it comes from Athenum's live cross-venue derivatives feed. All 34 calculators on the site are free to use, and they ask for no account, no email, and impose no usage limits. Size a position in the free liquidation calculator, or open the live terminal and watch the venue split move.
One terminal. All the data.
Liquidations, orderbook depth, whale walls & open interest from 4 exchanges, all real-time, in one place.
No credit card required

Athenum Analytics
Athenum Analytics is our three-person editorial team covering crypto derivatives, market data and macroeconomic context.