Table of Contents6 sections
- How do you calculate PnL on a crypto perpetual?
- Why is your net PnL smaller than the price move suggests?
- How much does funding change your PnL, and why does it differ by exchange?
- Where is your real breakeven after fees and funding?
- Long or short: how do the PnL terms flip?
- How do you calculate your crypto futures PnL yourself?
Practise with worked lessons
- Calculate funding payments over your actual holding window
Build a settlement-by-settlement funding ledger from position notional and signed rates. Keep funding separate from margin, trading fees and price P&L.
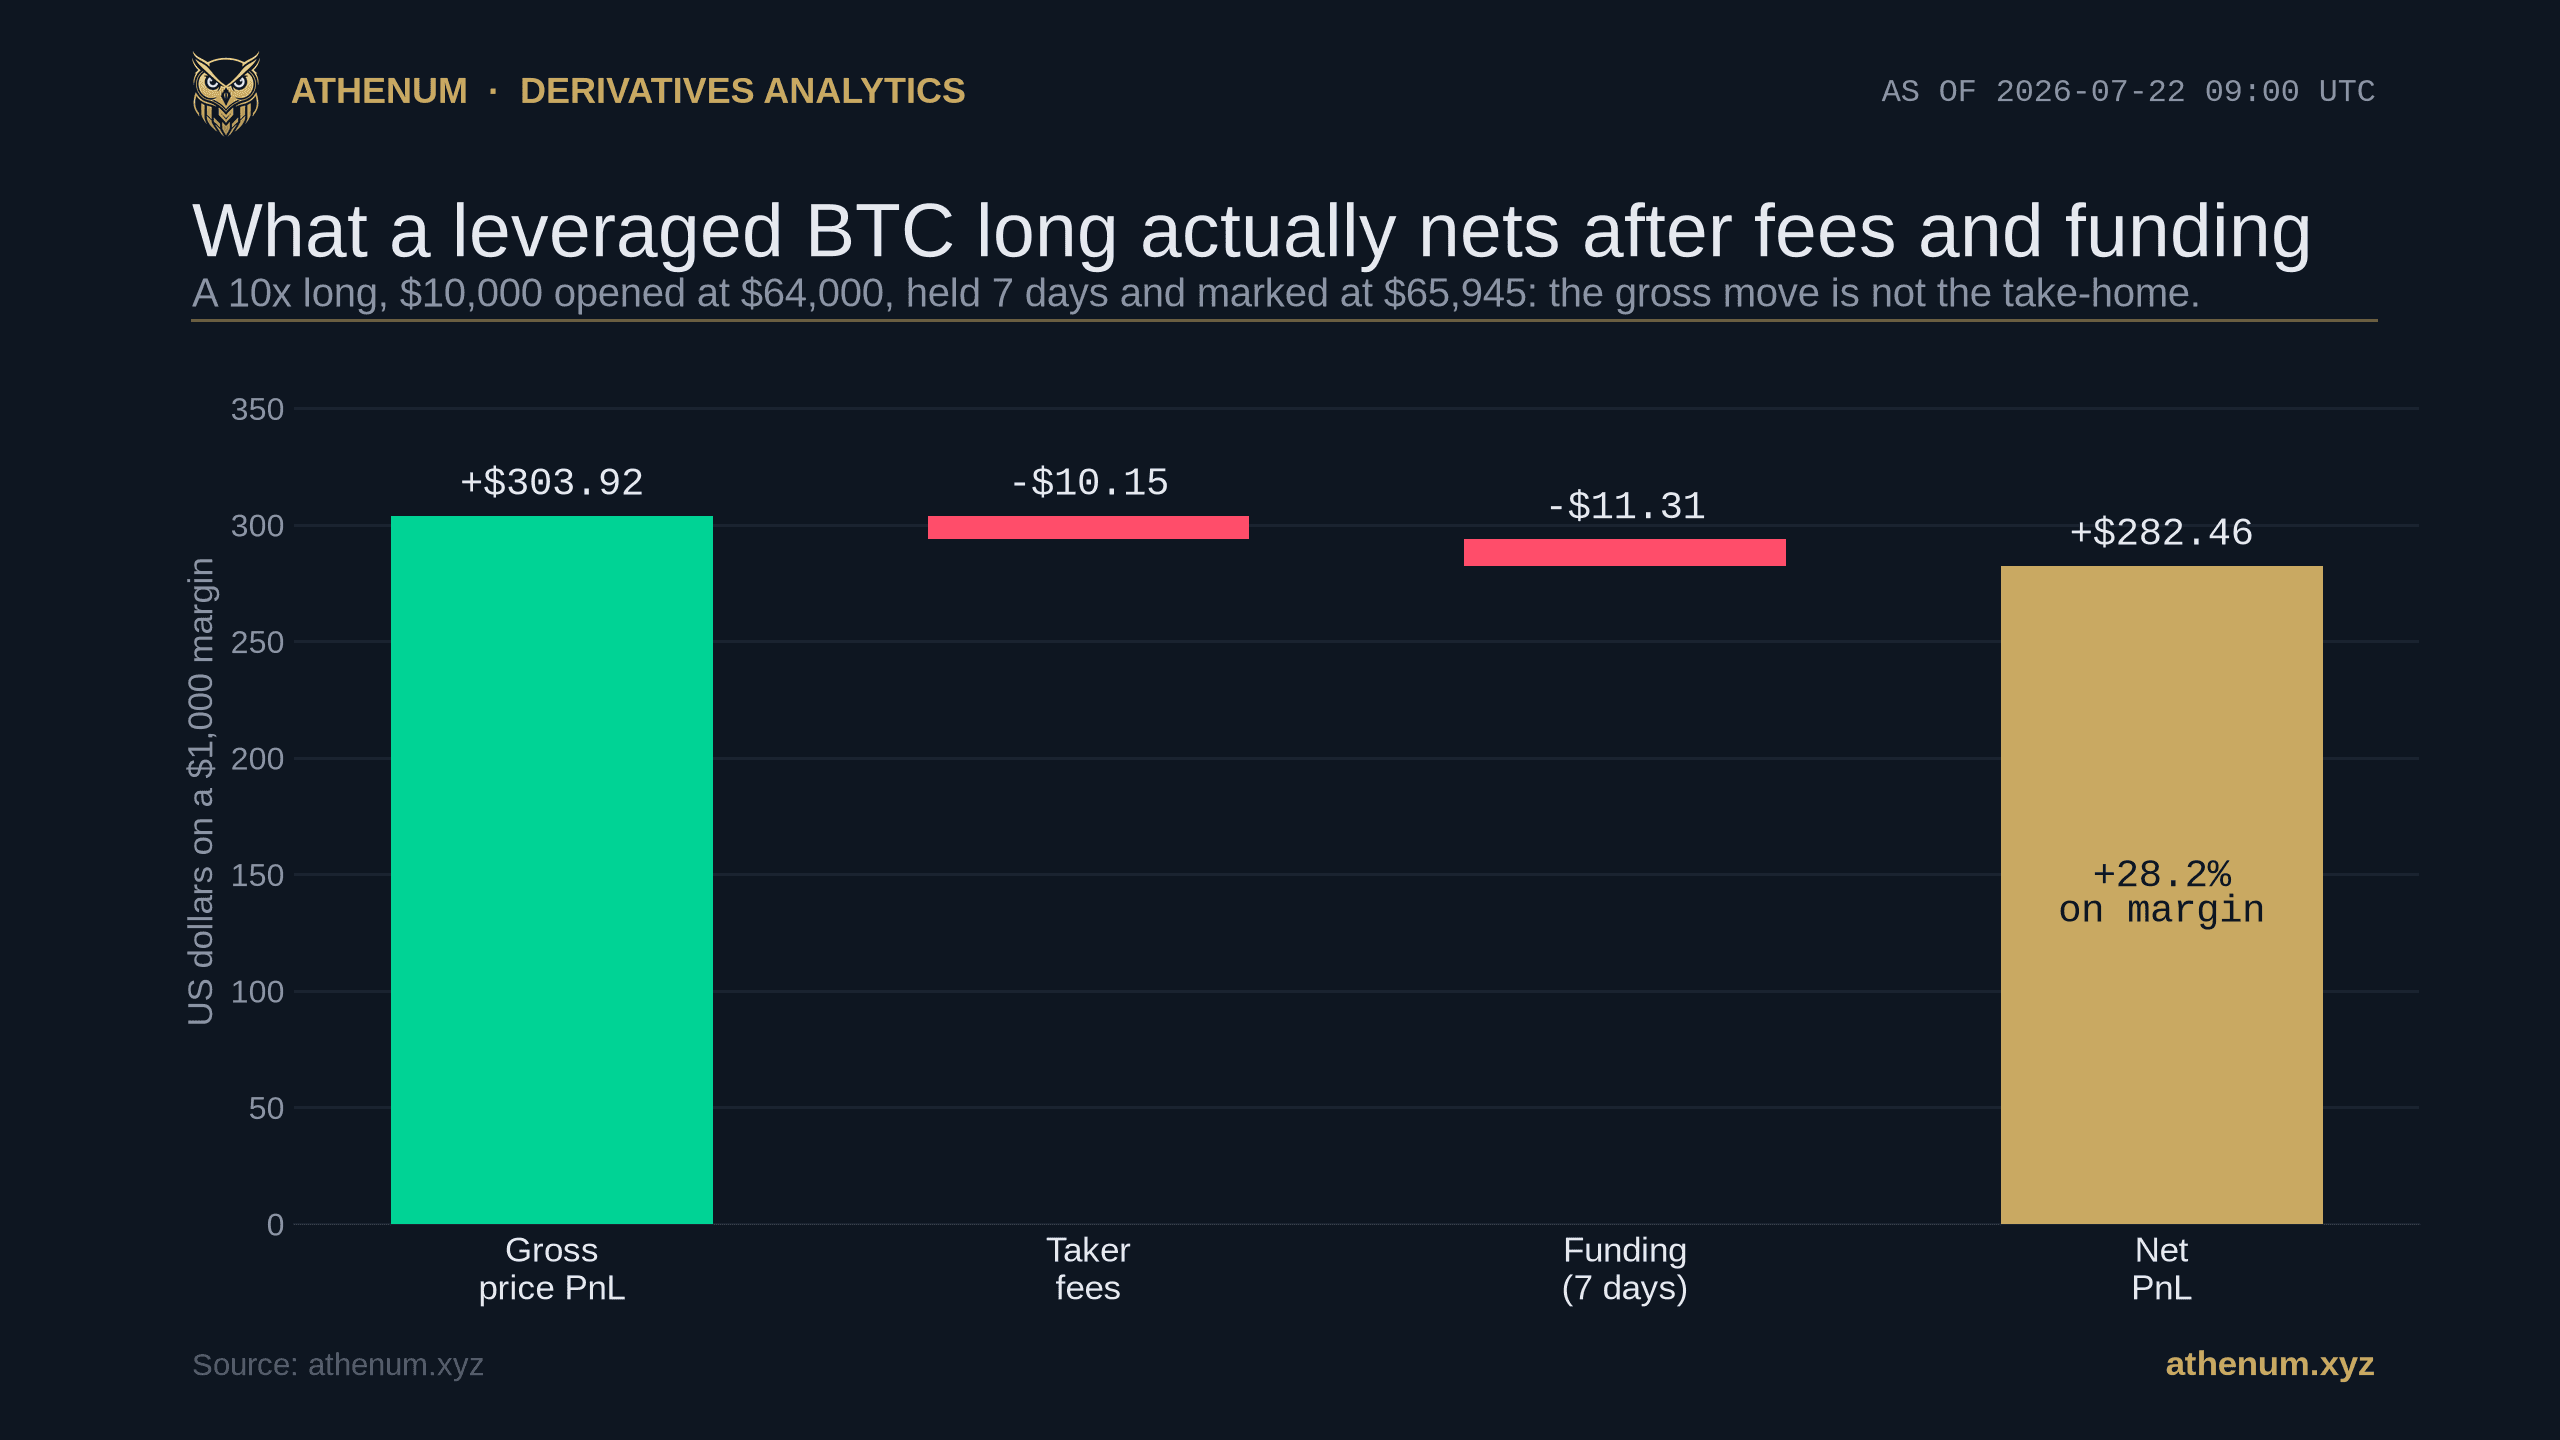
TLDR. Your crypto futures PnL is the sum of four things, not one: the direction and size of your position, the price move from entry to exit, the taker or maker fees you pay to get in and out, and the funding you exchange with the other side of the market every interval you hold. Most quick calculators show only the price move, so they overstate what you actually keep. Worked with Athenum's live feed on 2026-07-22, a 10x BTC long of $10,000 opened at $64,000 and marked near $65,945 shows a gross price gain of about $303.92, but roughly $10.15 in taker fees and $11.31 of funding over seven days pull the net down to about $282.46, a return of +28.2% on the $1,000 of margin rather than the +30.4% the price move alone implies. Funding is also the term that differs most by venue: at 09:00 UTC on 2026-07-22 the same position's seven-day funding ranged from about -$3.26 on OKX, where the long was actually paid, to about +$16.80 on Hyperliquid across the venues Athenum normalizes from its 14 exchanges.
How do you calculate PnL on a crypto perpetual?
Start with the identity every exchange uses under the hood. For a position of a given size, your gross price PnL is the size in the base asset multiplied by the price change in your favor:
- Long: gross PnL = size x (exit price - entry price) - Short: gross PnL = size x (entry price - exit price)
Size is the position's notional divided by the entry price. Take the worked example above: a $10,000 notional long opened at $64,000 controls 0.15625 BTC. Marked at $65,945 on 2026-07-22 (the live feed read $65,945.10), the gross price PnL is 0.15625 x ($65,945.10 - $64,000), about $303.92. Because the position used 10x leverage, that $303.92 sits on just $1,000 of margin, so the gross return on margin is about +30.4% even though BTC moved only about +3.0%. Leverage multiplies the percentage move; it does not change the dollar math of the price leg.
That gross number is where most calculators stop, and it is only unrealized PnL: the price leg becomes real money at the exit. The two remaining terms, fees and funding, are settled along the way, and they are why your net is smaller than the headline (the cover chart above traces the same trade from gross to net).
Why is your net PnL smaller than the price move suggests?
Two deductions sit between the gross price move and your take-home, and they behave very differently.
The first is trading fees. Every perp charges a fee to open and a fee to close, quoted as a percentage of notional. A market order pays the taker fee, typically around 0.05% per side on the major venues; a resting limit order pays the lower maker fee, which on some exchanges is zero or a small rebate. In the worked example, a 0.05% taker fee costs about $5.00 to open the $10,000 position and about $5.15 to close the slightly larger $10,304 position, roughly $10.15 round turn. Fees are paid once per side and do not grow with time: a scalp and a month-long hold pay the same to get in and out.
The second is funding. A perpetual has no expiry, so exchanges use a funding payment to tether it to spot: at each funding interval, longs and shorts pay each other a small percentage of notional. When funding is positive, longs pay shorts, the normal state in a market that leans long; when it is negative, shorts pay longs. Unlike fees, funding never stops: it is charged every interval you hold, so the total scales with time. In the example, seven days of positive funding on Binance cost the long about $11.31. Hold the same position for a month and that bill grows to roughly $48.49, while the fees stay fixed at $10.15.

On 2026-07-22, taker fees stay fixed at $10.15 while funding keeps accruing with holding time, overtaking fees at about 6.3 days and reaching $48.49 by thirty days.
The crossover changes how you should weigh a trade. For a short scalp, fees are the dominant cost and funding is a rounding error; for a multi-day swing, funding quietly becomes the larger drag. On the Binance rate above, funding overtakes the round-turn fee at about 6.3 days.
How much does funding change your PnL, and why does it differ by exchange?
Here is the part almost no standalone calculator captures: the same position pays a different amount of funding depending on where you hold it, because each venue sets its own rate on its own schedule. Reading that spread is exactly what a cross-exchange feed is for. Across the 14 exchanges Athenum normalizes, the market-wide average funding was about +4.2% annualized on 2026-07-22, but that single number hides a wide per-venue range.
At 09:00 UTC on 2026-07-22, the seven-day funding cost of the same $10,000 BTC long looked like this by venue: about +$16.80 on Hyperliquid (an +8.6% annualized rate, charged hourly), +$11.31 on Binance (+5.8%), +$6.82 on Bitget (+3.5%), +$5.55 on Bybit (+2.9%), and about -$3.26 on OKX, where funding was slightly negative and the long was actually paid to hold (-1.7% annualized). That is a spread of roughly $20 on the same position over one week, driven entirely by venue choice.

On 2026-07-22 the same $10,000 BTC long's seven-day funding ranged from -$3.26 on OKX to +$16.80 on Hyperliquid, about a $20 swing from venue alone.
Two caveats keep this honest. First, funding moves through the day, so these are a single 09:00 UTC snapshot on 2026-07-22, not a fixed rate; the point is the dispersion, not the exact cents. Second, Deribit is left out of the comparison on purpose, because its funding updates continuously rather than on a fixed clock, so a point-in-time number is not a clean seven-day cost. For why the same perp charges funding on different schedules, see the explainer on funding rate intervals.
Where is your real breakeven after fees and funding?
Because fees and funding are always a cost for a long paying positive funding, your true breakeven sits above your entry, not at it. The exit has to clear the entry by enough to cover both.
In the worked example, the long needs BTC to rise from $64,000 to about $64,136 just to net zero after seven days of costs, a cushion of roughly $136, or about 0.2% of the entry price. Anything below that, even a small gain over entry, is still a net loss once fees and funding are paid. At the current mark of $65,945 on 2026-07-22 the trade clears that hurdle comfortably, netting about +$282.46, but the shifted breakeven is why a position that looks barely green on price can be red on your balance.

Net PnL vs exit price on 2026-07-22: fees and funding push breakeven to $64,136, about $136 above the $64,000 entry; the $65,945 mark nets +$282.46.
Leverage sharpens this. The same dollar cushion is a much larger share of a thin margin, and the closer your entry sits to your liquidation price, the less room a costs-shifted breakeven leaves you. Map your own bankruptcy and liquidation levels first in the free leverage and liquidation calculator, and if leverage sizing is the open question, the 10x vs 100x leverage explainer walks through the tradeoff.
Long or short: how do the PnL terms flip?
The price leg flips sign with direction, and the funding leg flips with the sign of the market's funding, so a short is not simply a mirror image of a long. The table sums up how each term behaves.
PnL term | Long position | Short position |
|---|---|---|
Gross price PnL | size x (exit - entry) | size x (entry - exit) |
Taker fees | A cost on both sides, about 0.05% each | A cost on both sides, about 0.05% each |
Funding, market positive | Paid by the long, a cost | Received by the short, a credit |
Funding, market negative | Received by the long, a credit | Paid by the short, a cost |
Real breakeven | Above entry by fees plus funding paid | Below entry by fees, net of funding |
On 2026-07-22, with funding positive on most venues, a long paid to hold while a short was paid on those venues, and on OKX the sign was reversed. That is why the funding column, not the price column, is where venue choice and the market's lean quietly decide part of your PnL.
How do you calculate your crypto futures PnL yourself?
Turn it into a repeatable five-step check before and after every trade:
1. Compute the price leg. Size equals notional divided by entry price; gross PnL is size times the price change in your favor. Express it on margin, not notional, to read the leveraged return honestly. 2. Subtract the round-turn fees. Use the taker rate if you cross the spread, the maker rate if you rest the order, on both the open and the close. 3. Subtract, or add, funding for every interval you held. Positive funding is a cost for a long and a credit for a short; multiply the rate by notional by the number of intervals. 4. Check where you actually held it. The funding term can swing by roughly $20 per $10,000 over a week across venues, so the cheapest place to hold a crowded-long position is the venue with the lowest, or negative, funding. 5. Set your real breakeven above entry by the fees plus funding, and size the trade so a costs-shifted breakeven still sits a safe distance from your liquidation price.
You can price every one of these terms before you commit: the free PnL calculator handles the price leg and fees, the funding rate calculator turns a rate into the dollar cost of a hold, and the leverage and liquidation calculator fixes your breakeven against your liquidation price. If perps themselves are still new, start with what are perpetual futures.
You can price every figure in this post before you ever open the trade. Athenum streams live derivatives data from 14 exchanges into one normalized view and keeps its 34 calculators free, with no account, no email, and no usage limits. Run your own numbers in the free PnL calculator and funding rate calculator, then open the live Athenum terminal to read the funding you would actually pay on a position right now.
One terminal. All the data.
Liquidations, orderbook depth, whale walls & open interest from 4 exchanges, all real-time, in one place.
No credit card required

Athenum Analytics
Athenum Analytics is our three-person editorial team covering crypto derivatives, market data and macroeconomic context.