7 days Pro+ free · no cardStart my free trial
Skip to content

THE CONNECTED MARKET WORKSPACE

Market context.
One workspace.

Athenum is an analytics terminal for traders and analysts. Compare global events, market positioning and order flow in one workspace.

No credit card required

IRAN WAR / GLOBAL IMPACT

One conflict.
Global consequences.

Iran war: talks to reopen Hormuz face major hurdles

Mediators are seeking an end to the fighting and a reopening of the waterway connecting Gulf oil exports with global markets.

Location
Strait of Hormuz
Country
Iran / Oman
Read at AP · Local 10 ↗

Map context · waterway, not an incident location

Fixed news example, not a live feed. The report describes the situation on its publication date.
Exchange feeds and public data sources.

Examples of data sources, not partners. Coverage and update frequency vary by source, market and tool.

FROM THE BIG PICTURE TO THE DETAIL

One market.
Six perspectives.

An event is only the beginning. Explore its context, examine positioning and investigate the market in one workspace.

01 / 06World Map

Connect events to the markets.

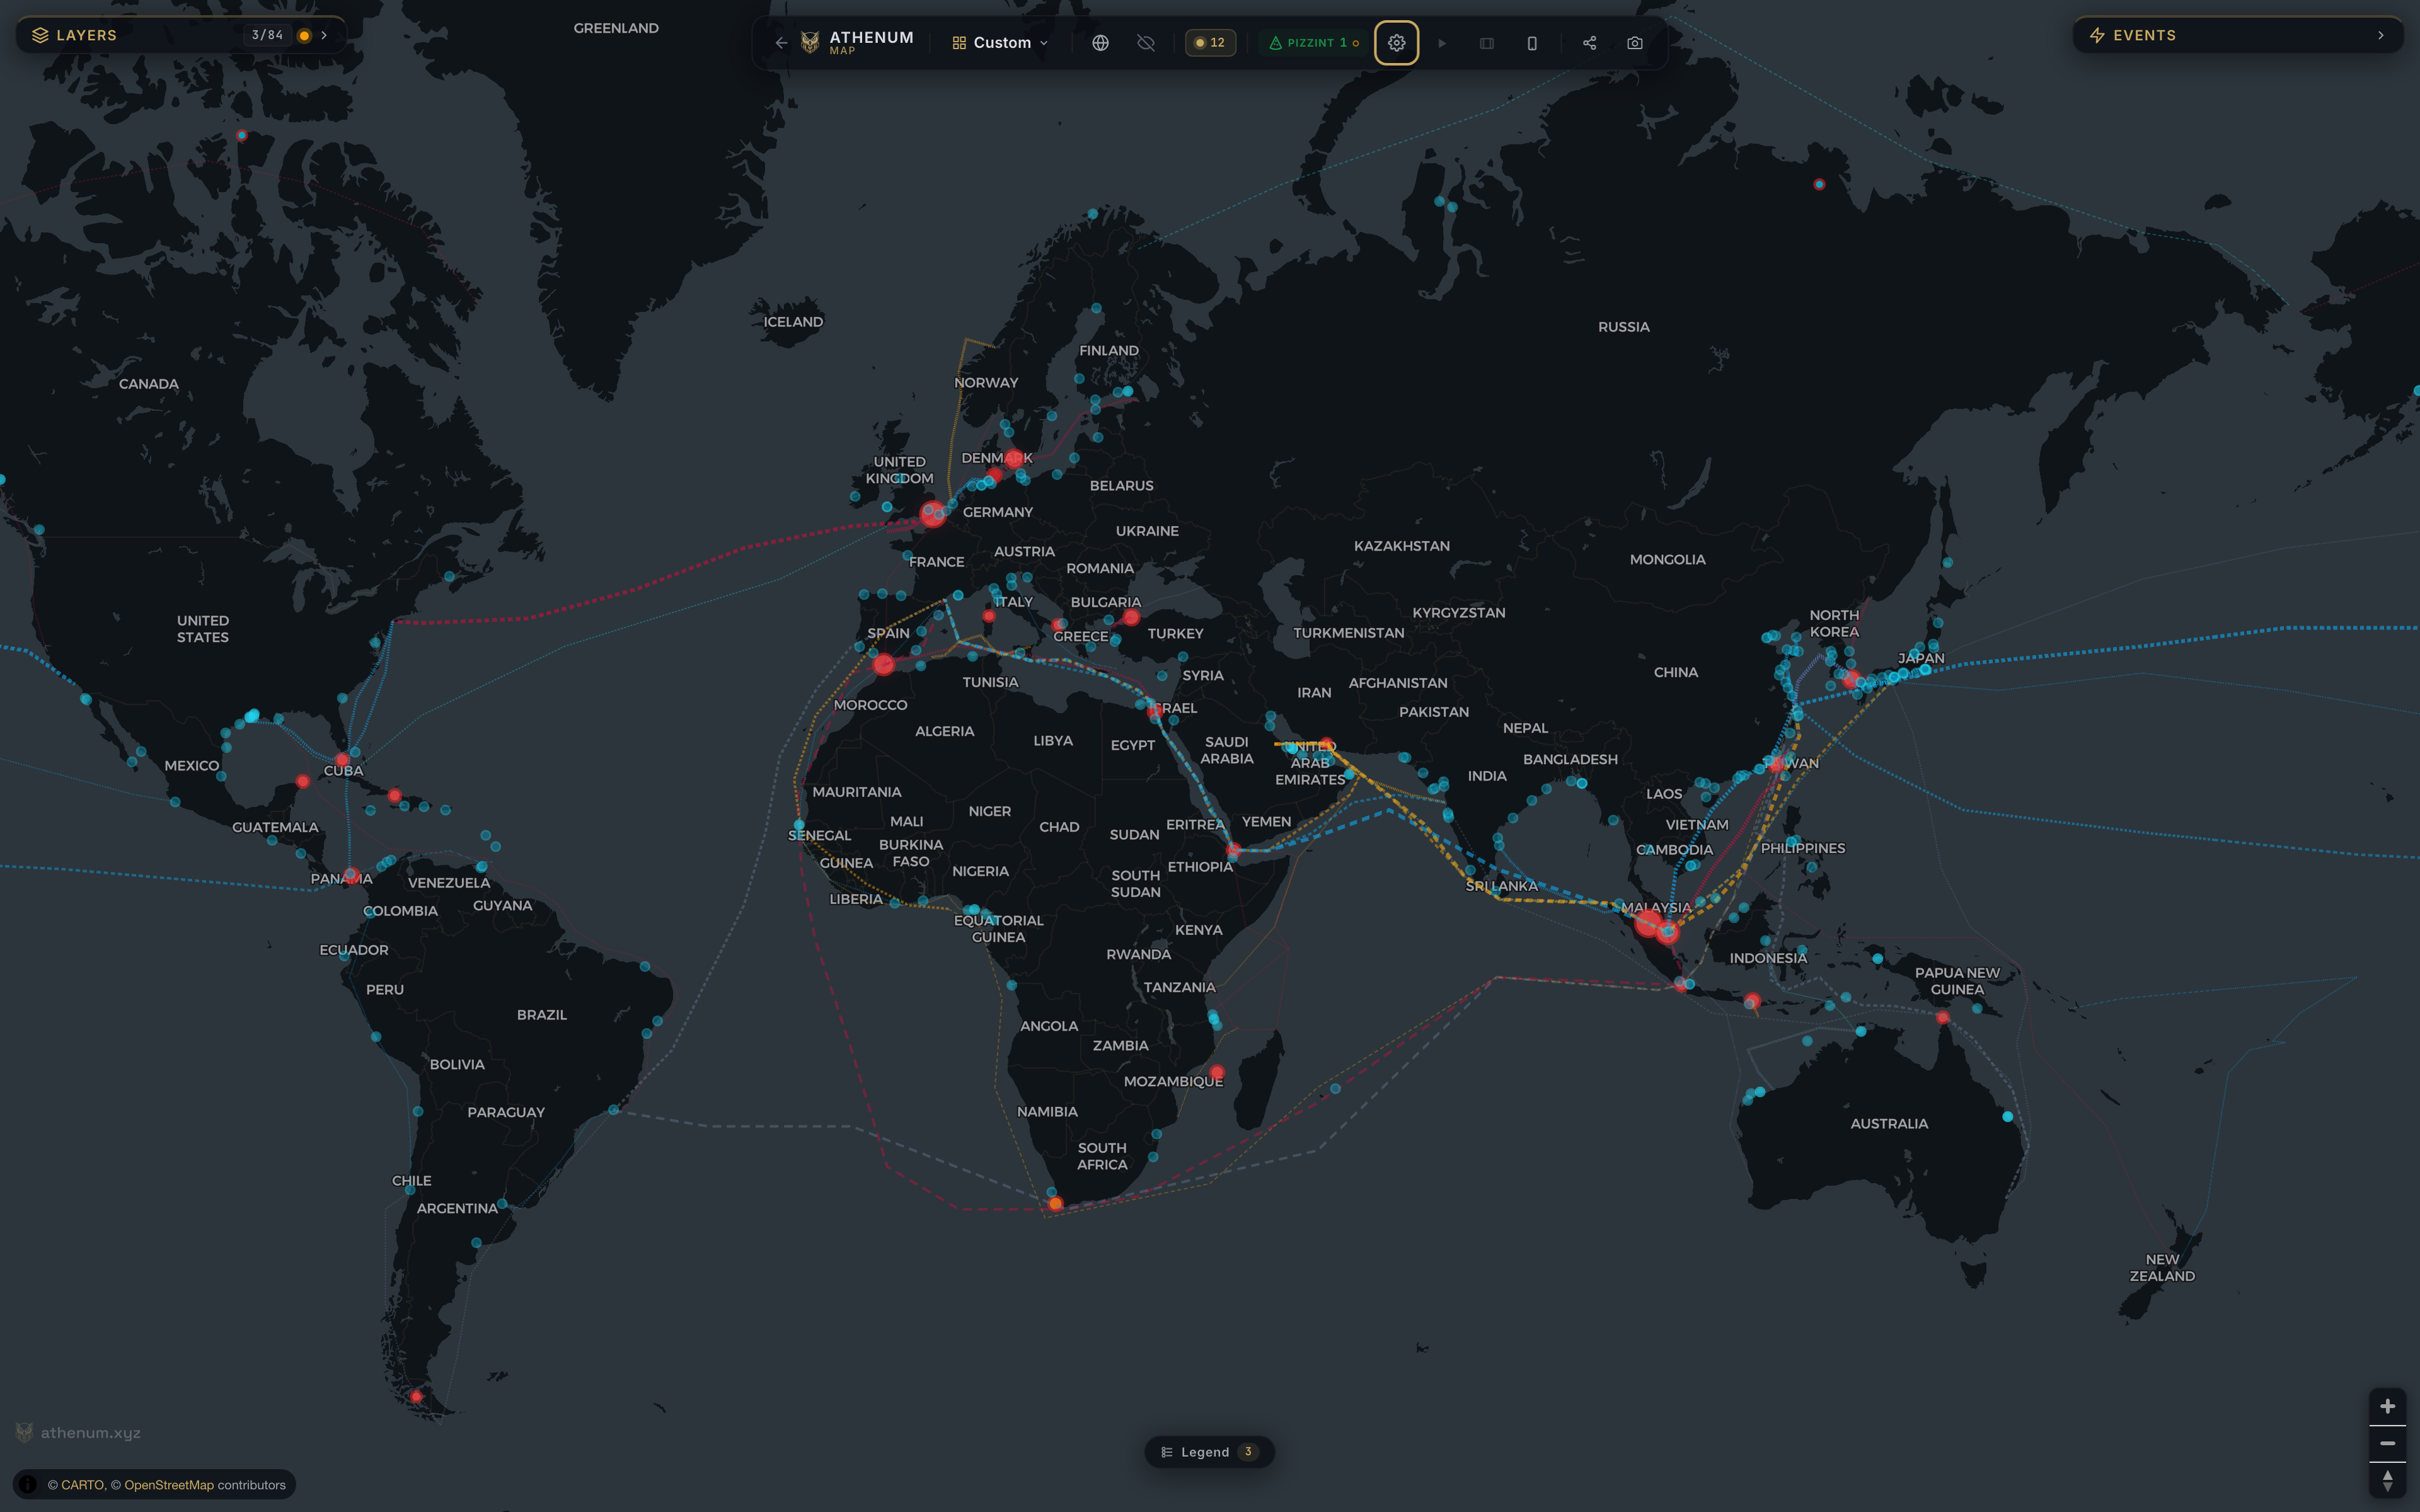
Explore geopolitical events, shipping routes and critical infrastructure. Map layers carry source and freshness information.

  • News and events
  • Geopolitical layers
  • Shipping routes
ATHENUM / World Map
Historical Athenum World Map with shipping routes, trade chokepoints and LNG terminals.
Shipping routes · Trade chokepointsActual product view

Real app recordings · Dated recordings: September 16 – 24, 2026. The displayed market values and source status reflect the time of recording. TradeFi availability varies by module. Product areas and subscription domains are different: see plan details below.

A WORKFLOW THAT FITS TOGETHER

Check a thesis from three angles.

Build context. Locate risk. Check liquidity. Three connected steps, in one research workspace.

Start with the backdrop.

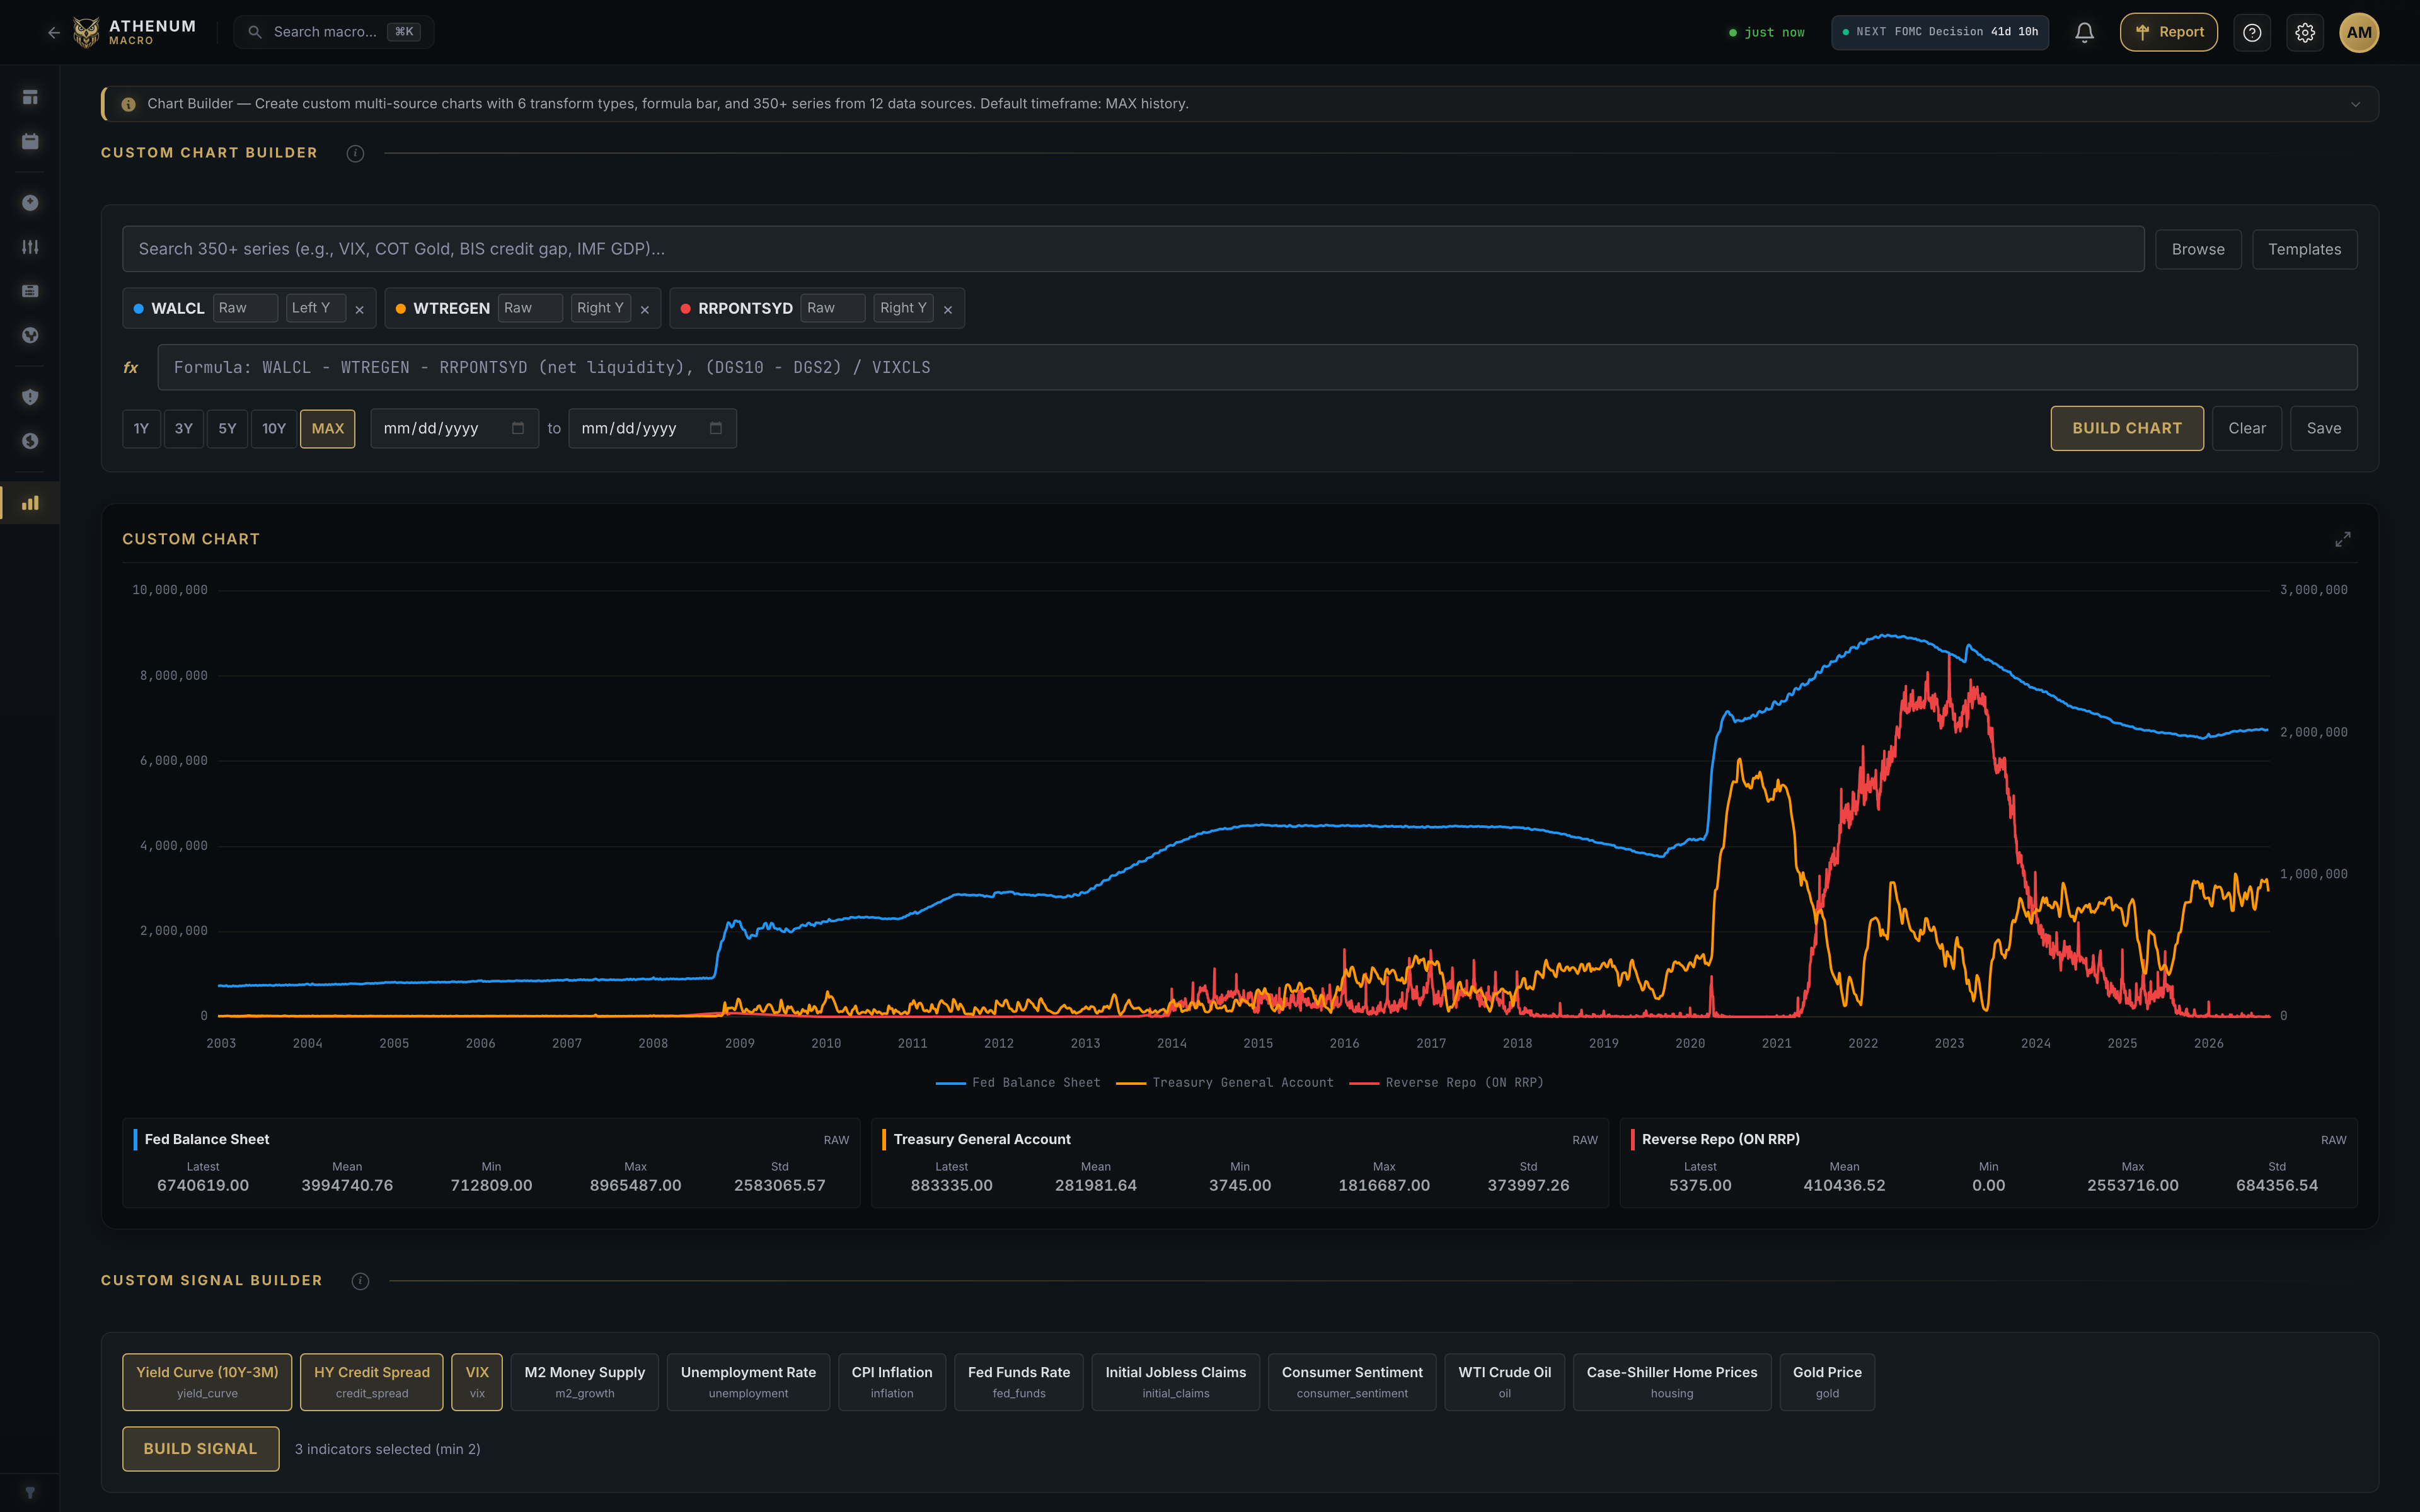
Compare economic series and liquidity conditions in Macro Chart Builder.

Macro · Chart Builder
Athenum Macro Chart Builder comparing the Fed balance sheet, Treasury General Account and reverse repos.
Actual product view

Put risk in context.

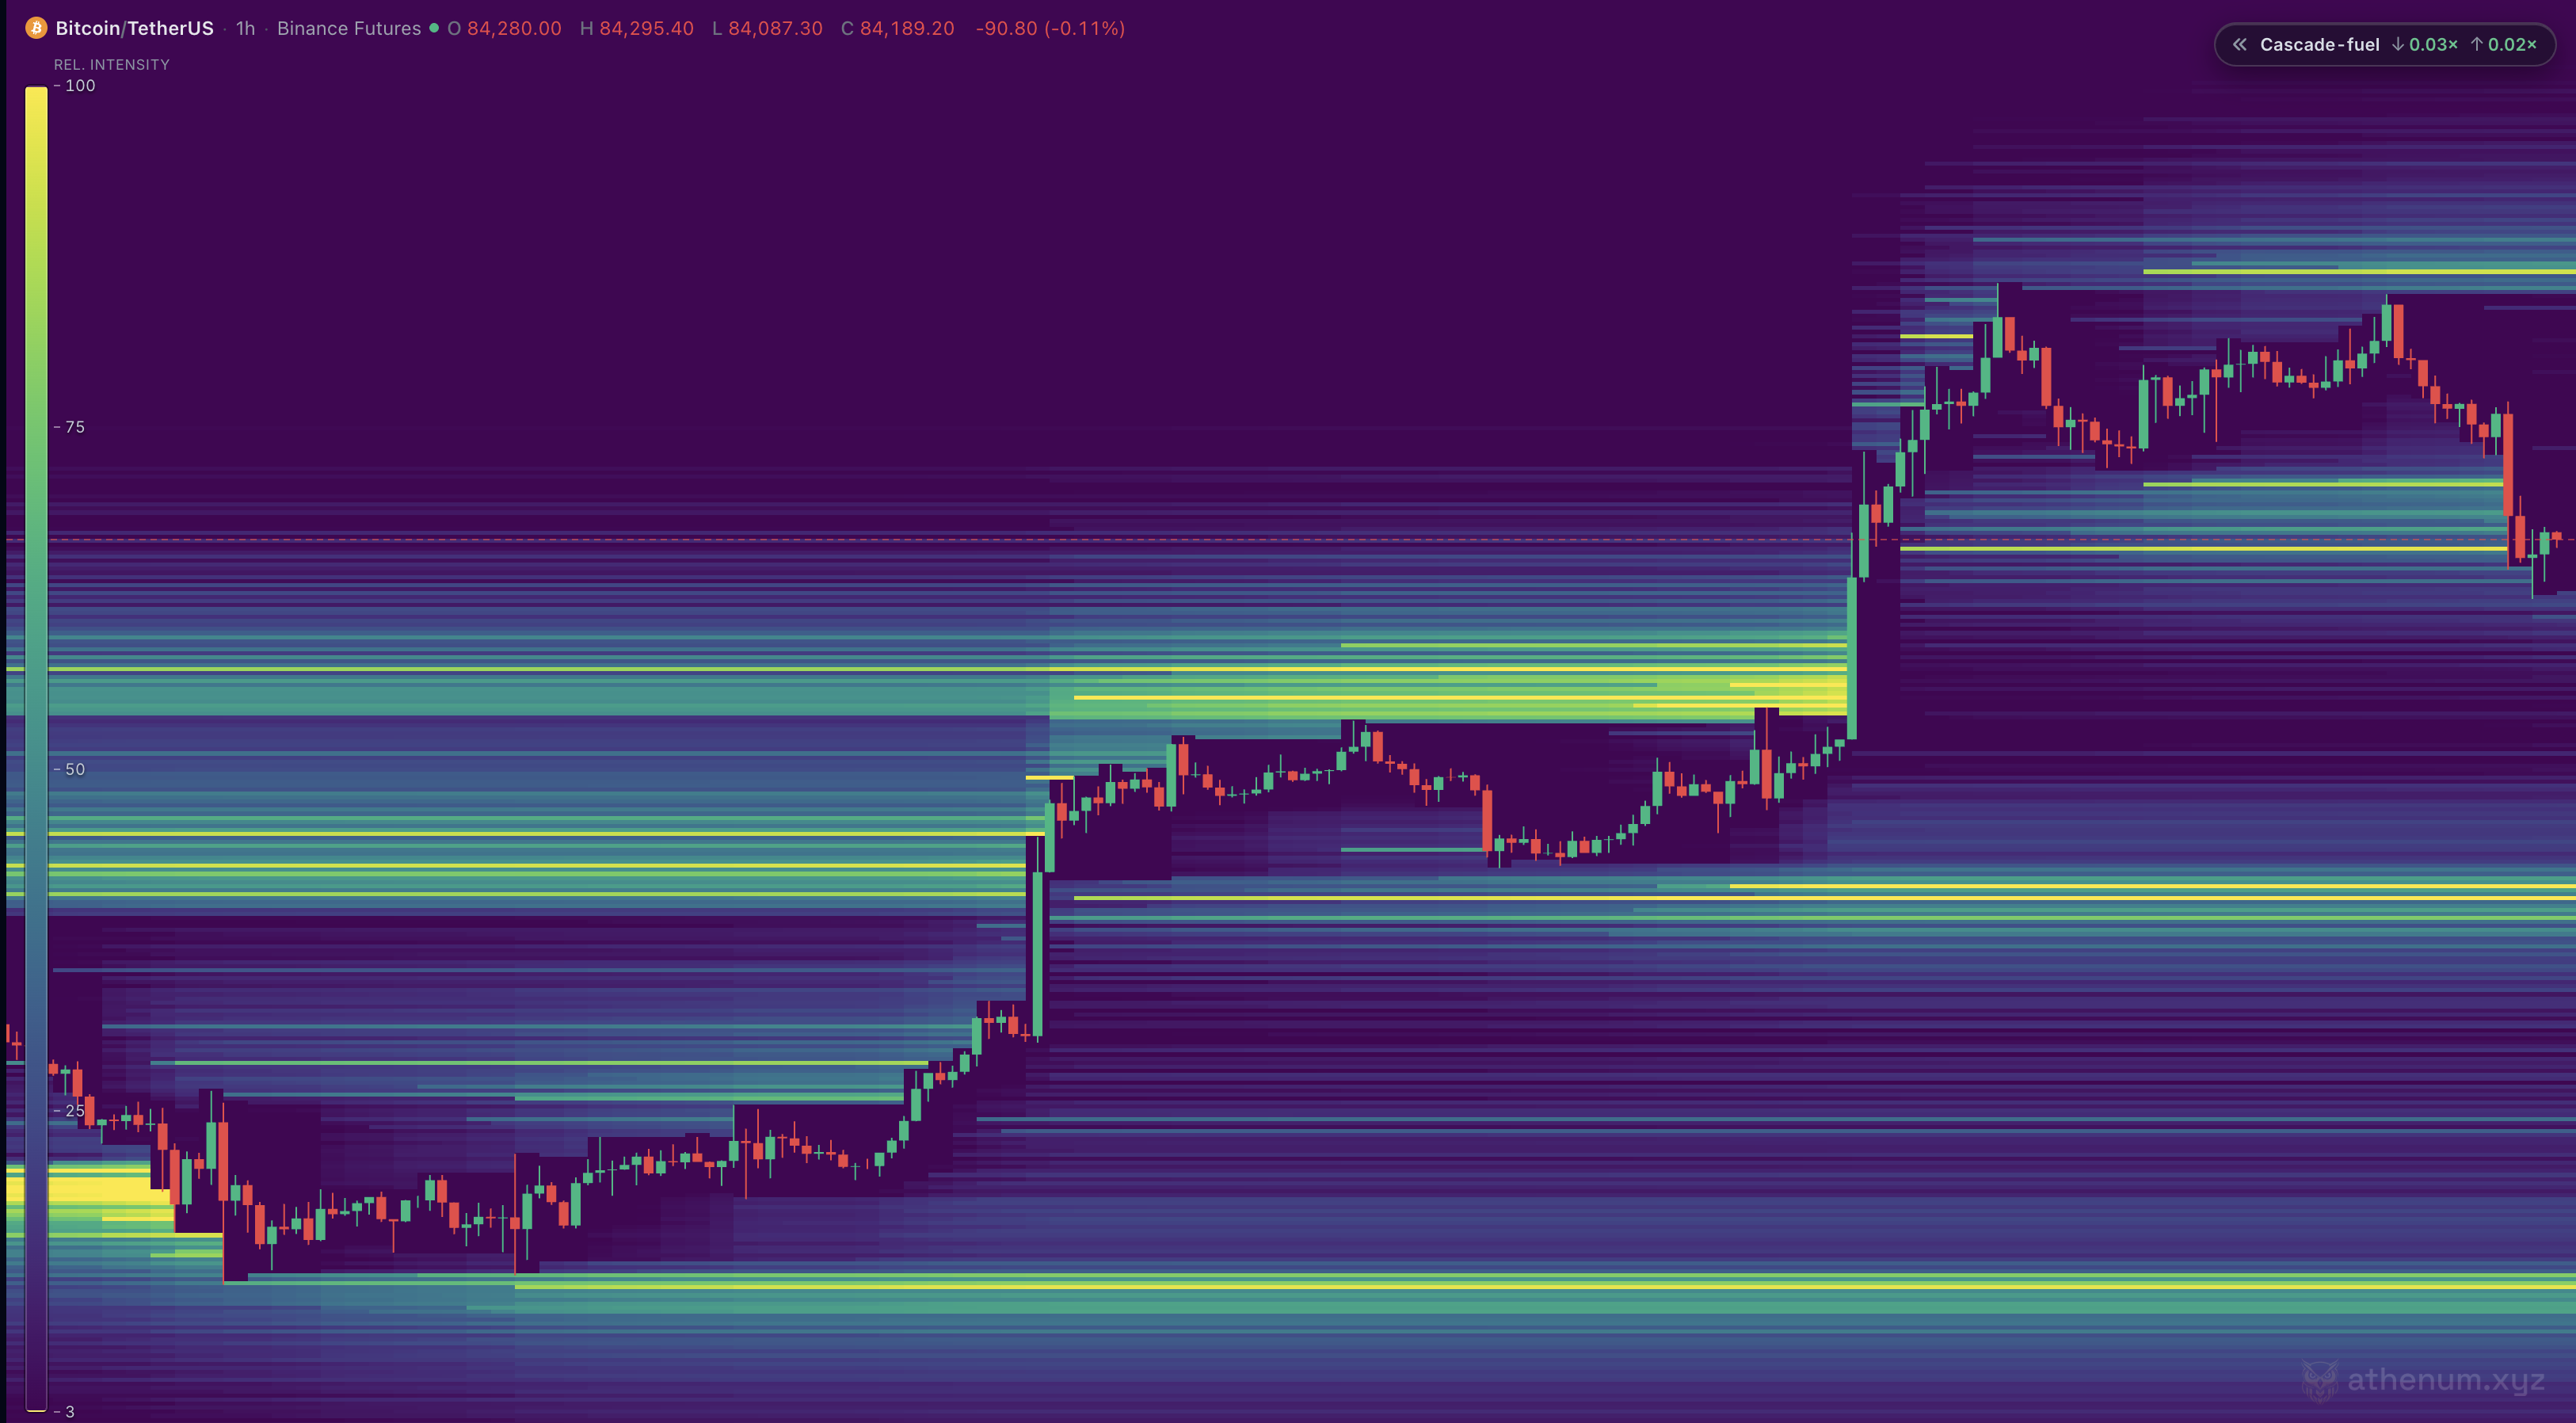
Compare price with estimated BTC/USDT liquidation zones. The heatmap is a model, not a forecast.

Derivatives · Liquidation Heatmap
BTC/USDT liquidation heatmap on Binance Futures, 1h, with the Cascade-fuel panel collapsed.
Actual product view

Inspect resting liquidity.

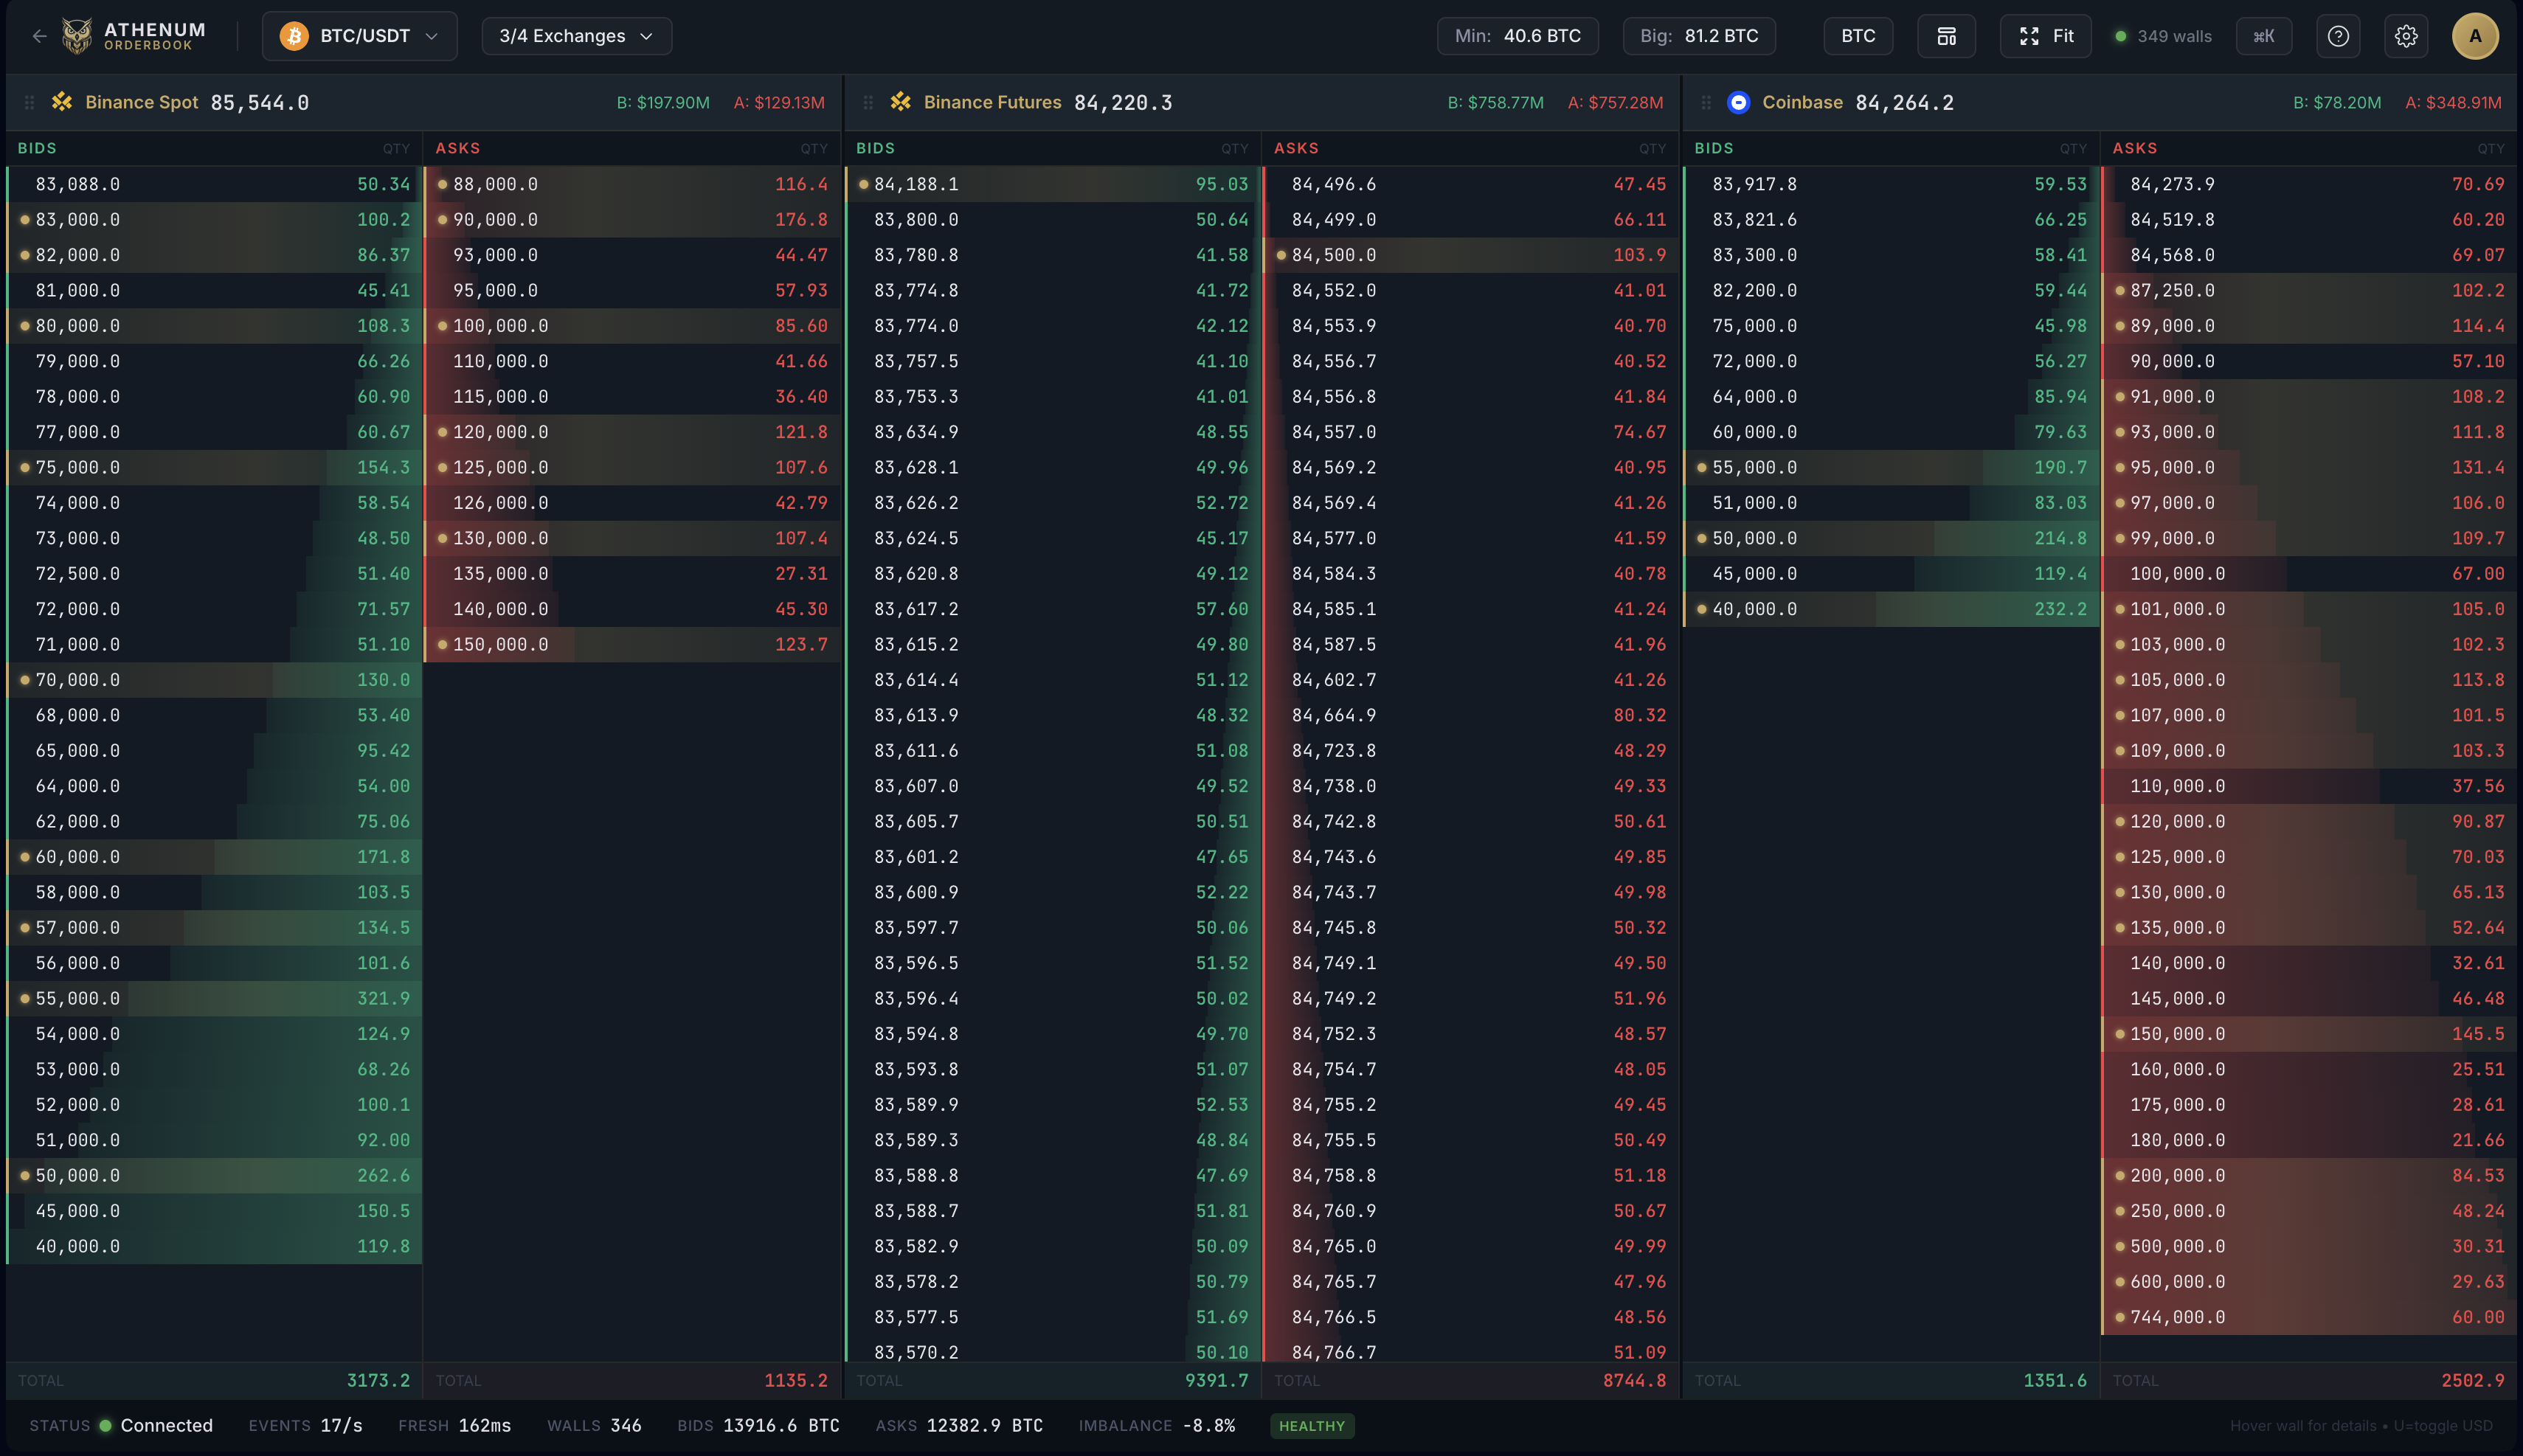
Compare large bids and asks in Whale Walls by price and BTC size. Resting orders can change or be cancelled; they are not executed trades.

Order Flow · Whale Walls
Athenum Whale Walls orderbook for BTC/USDT across Binance Spot, Binance Futures and Coinbase.
Actual product view

Historical product captures, recorded separately. These steps illustrate a research process, not an automatic link between a news event and a trade.

GUIDED PRODUCT TOUR · MARKET MOVEMENT

Read the market.
Understand the move.

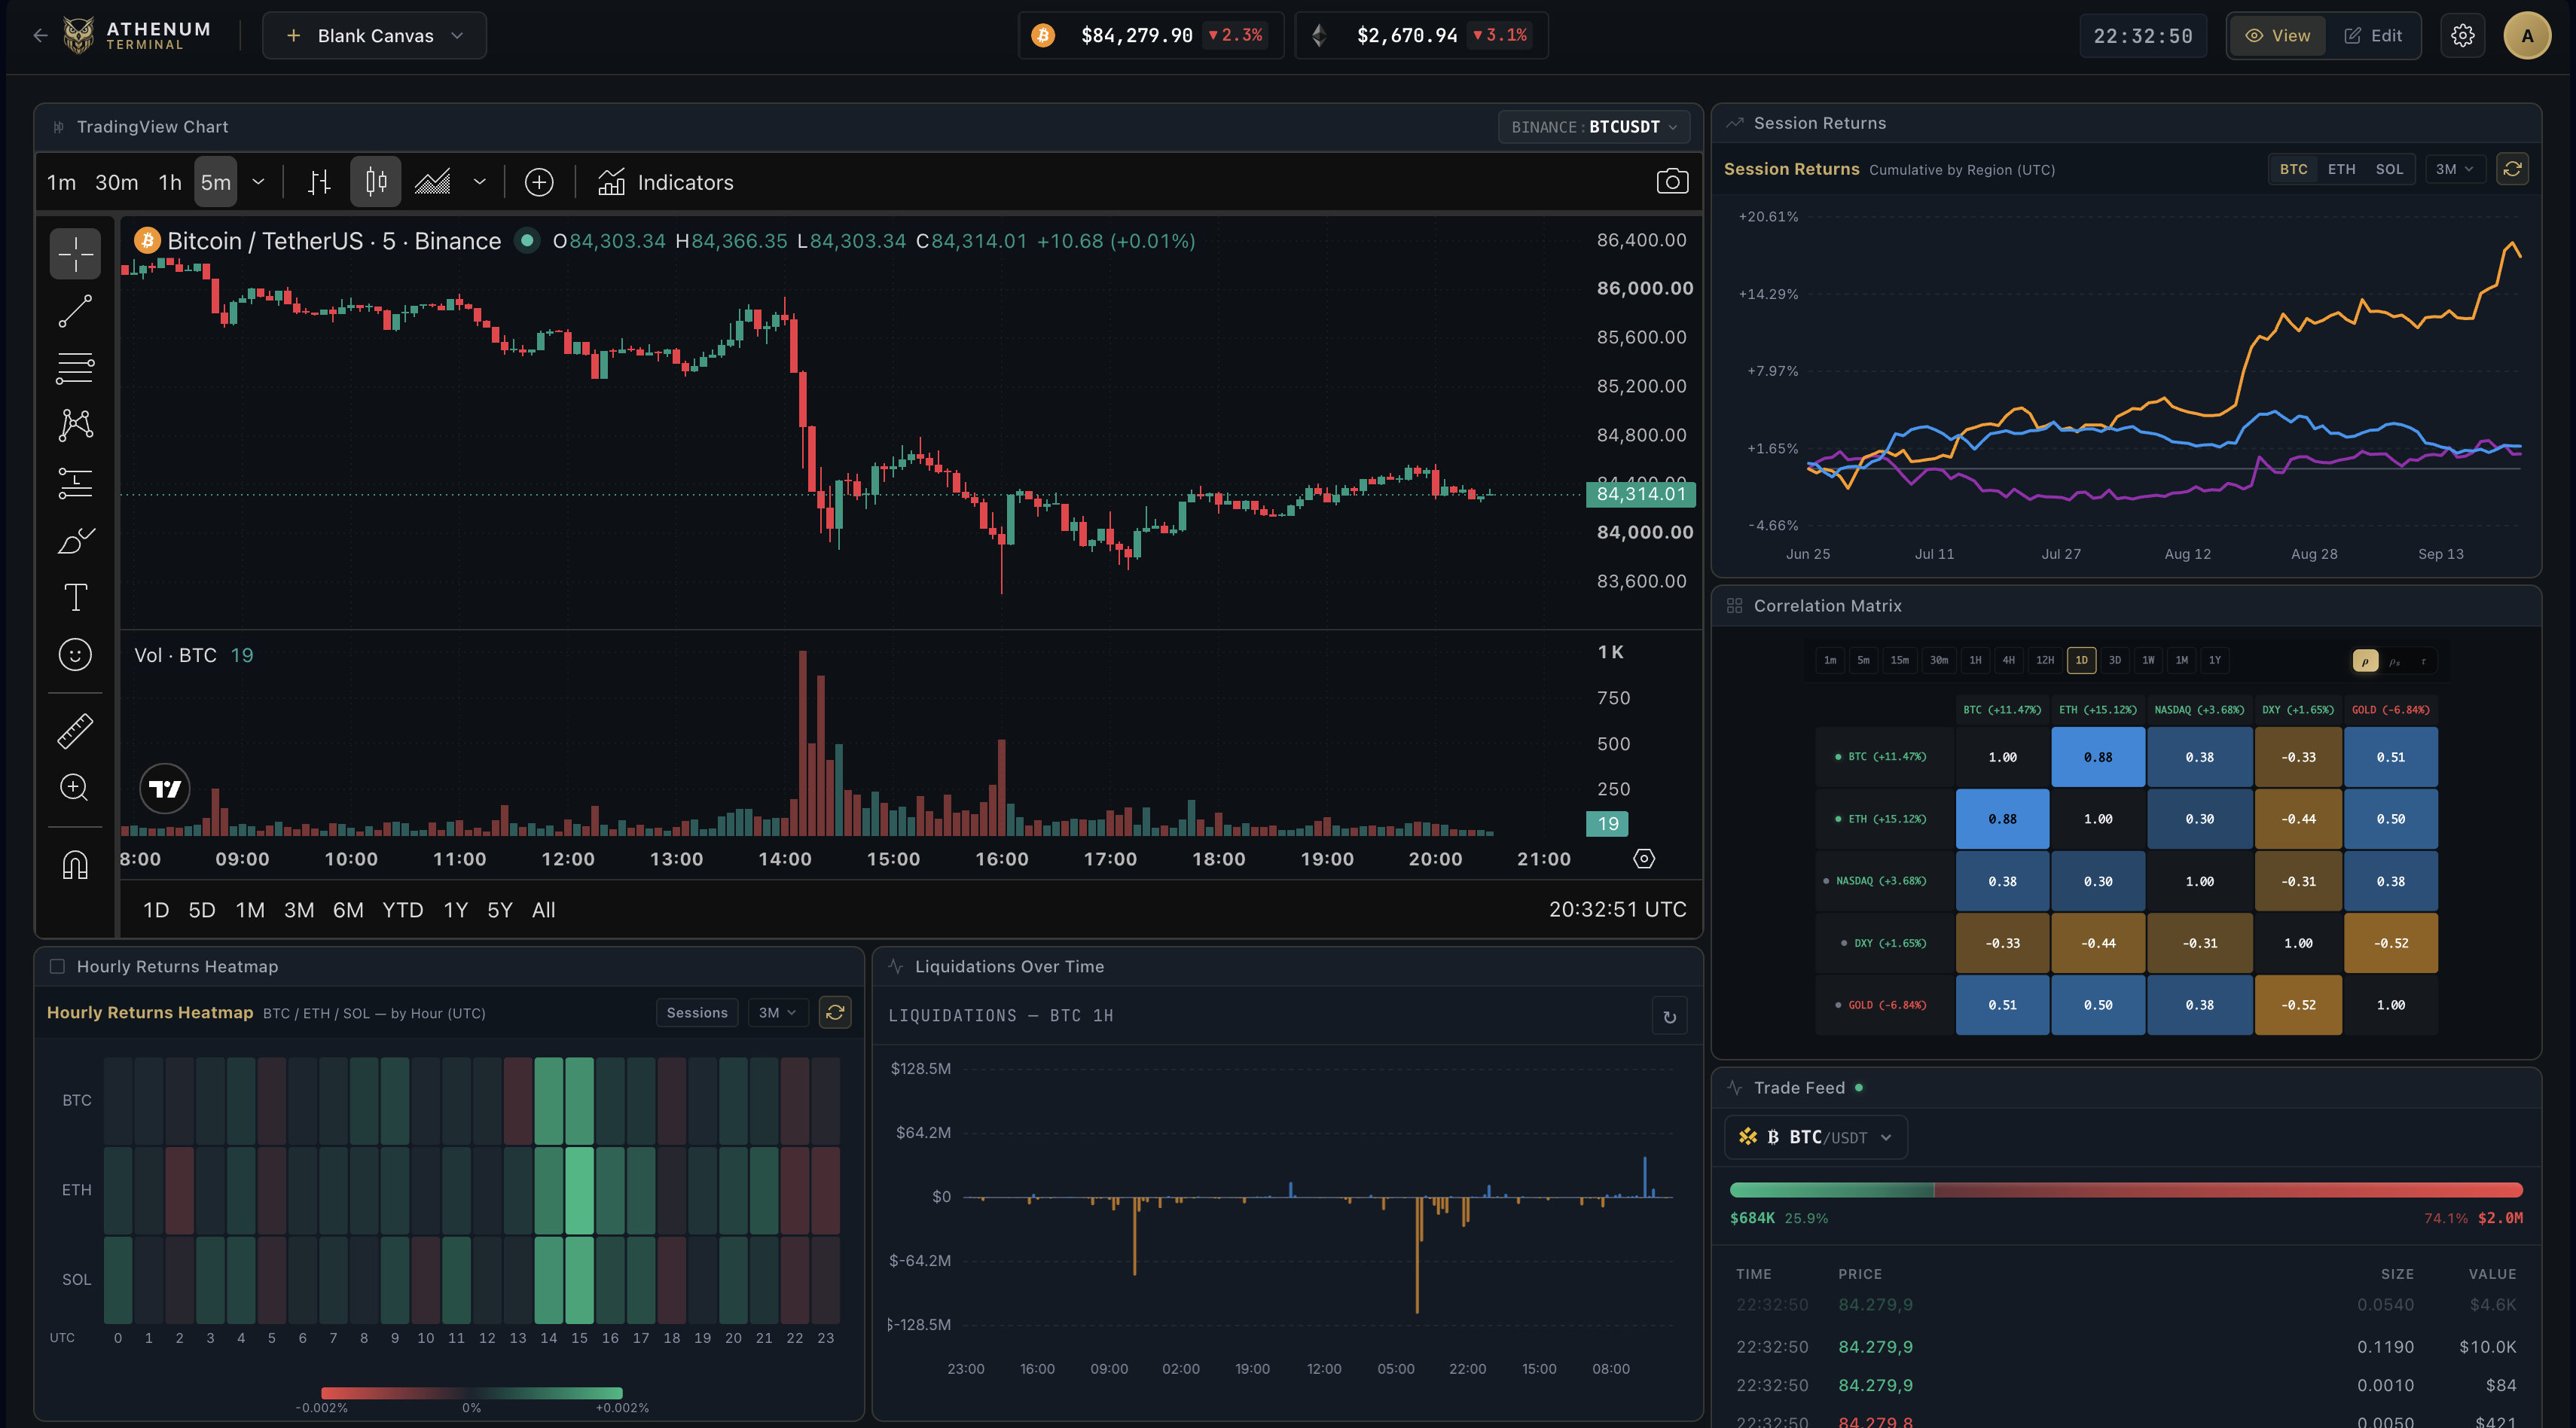
01Terminal

See the bigger picture.

View BTC price, session returns and market correlations together.

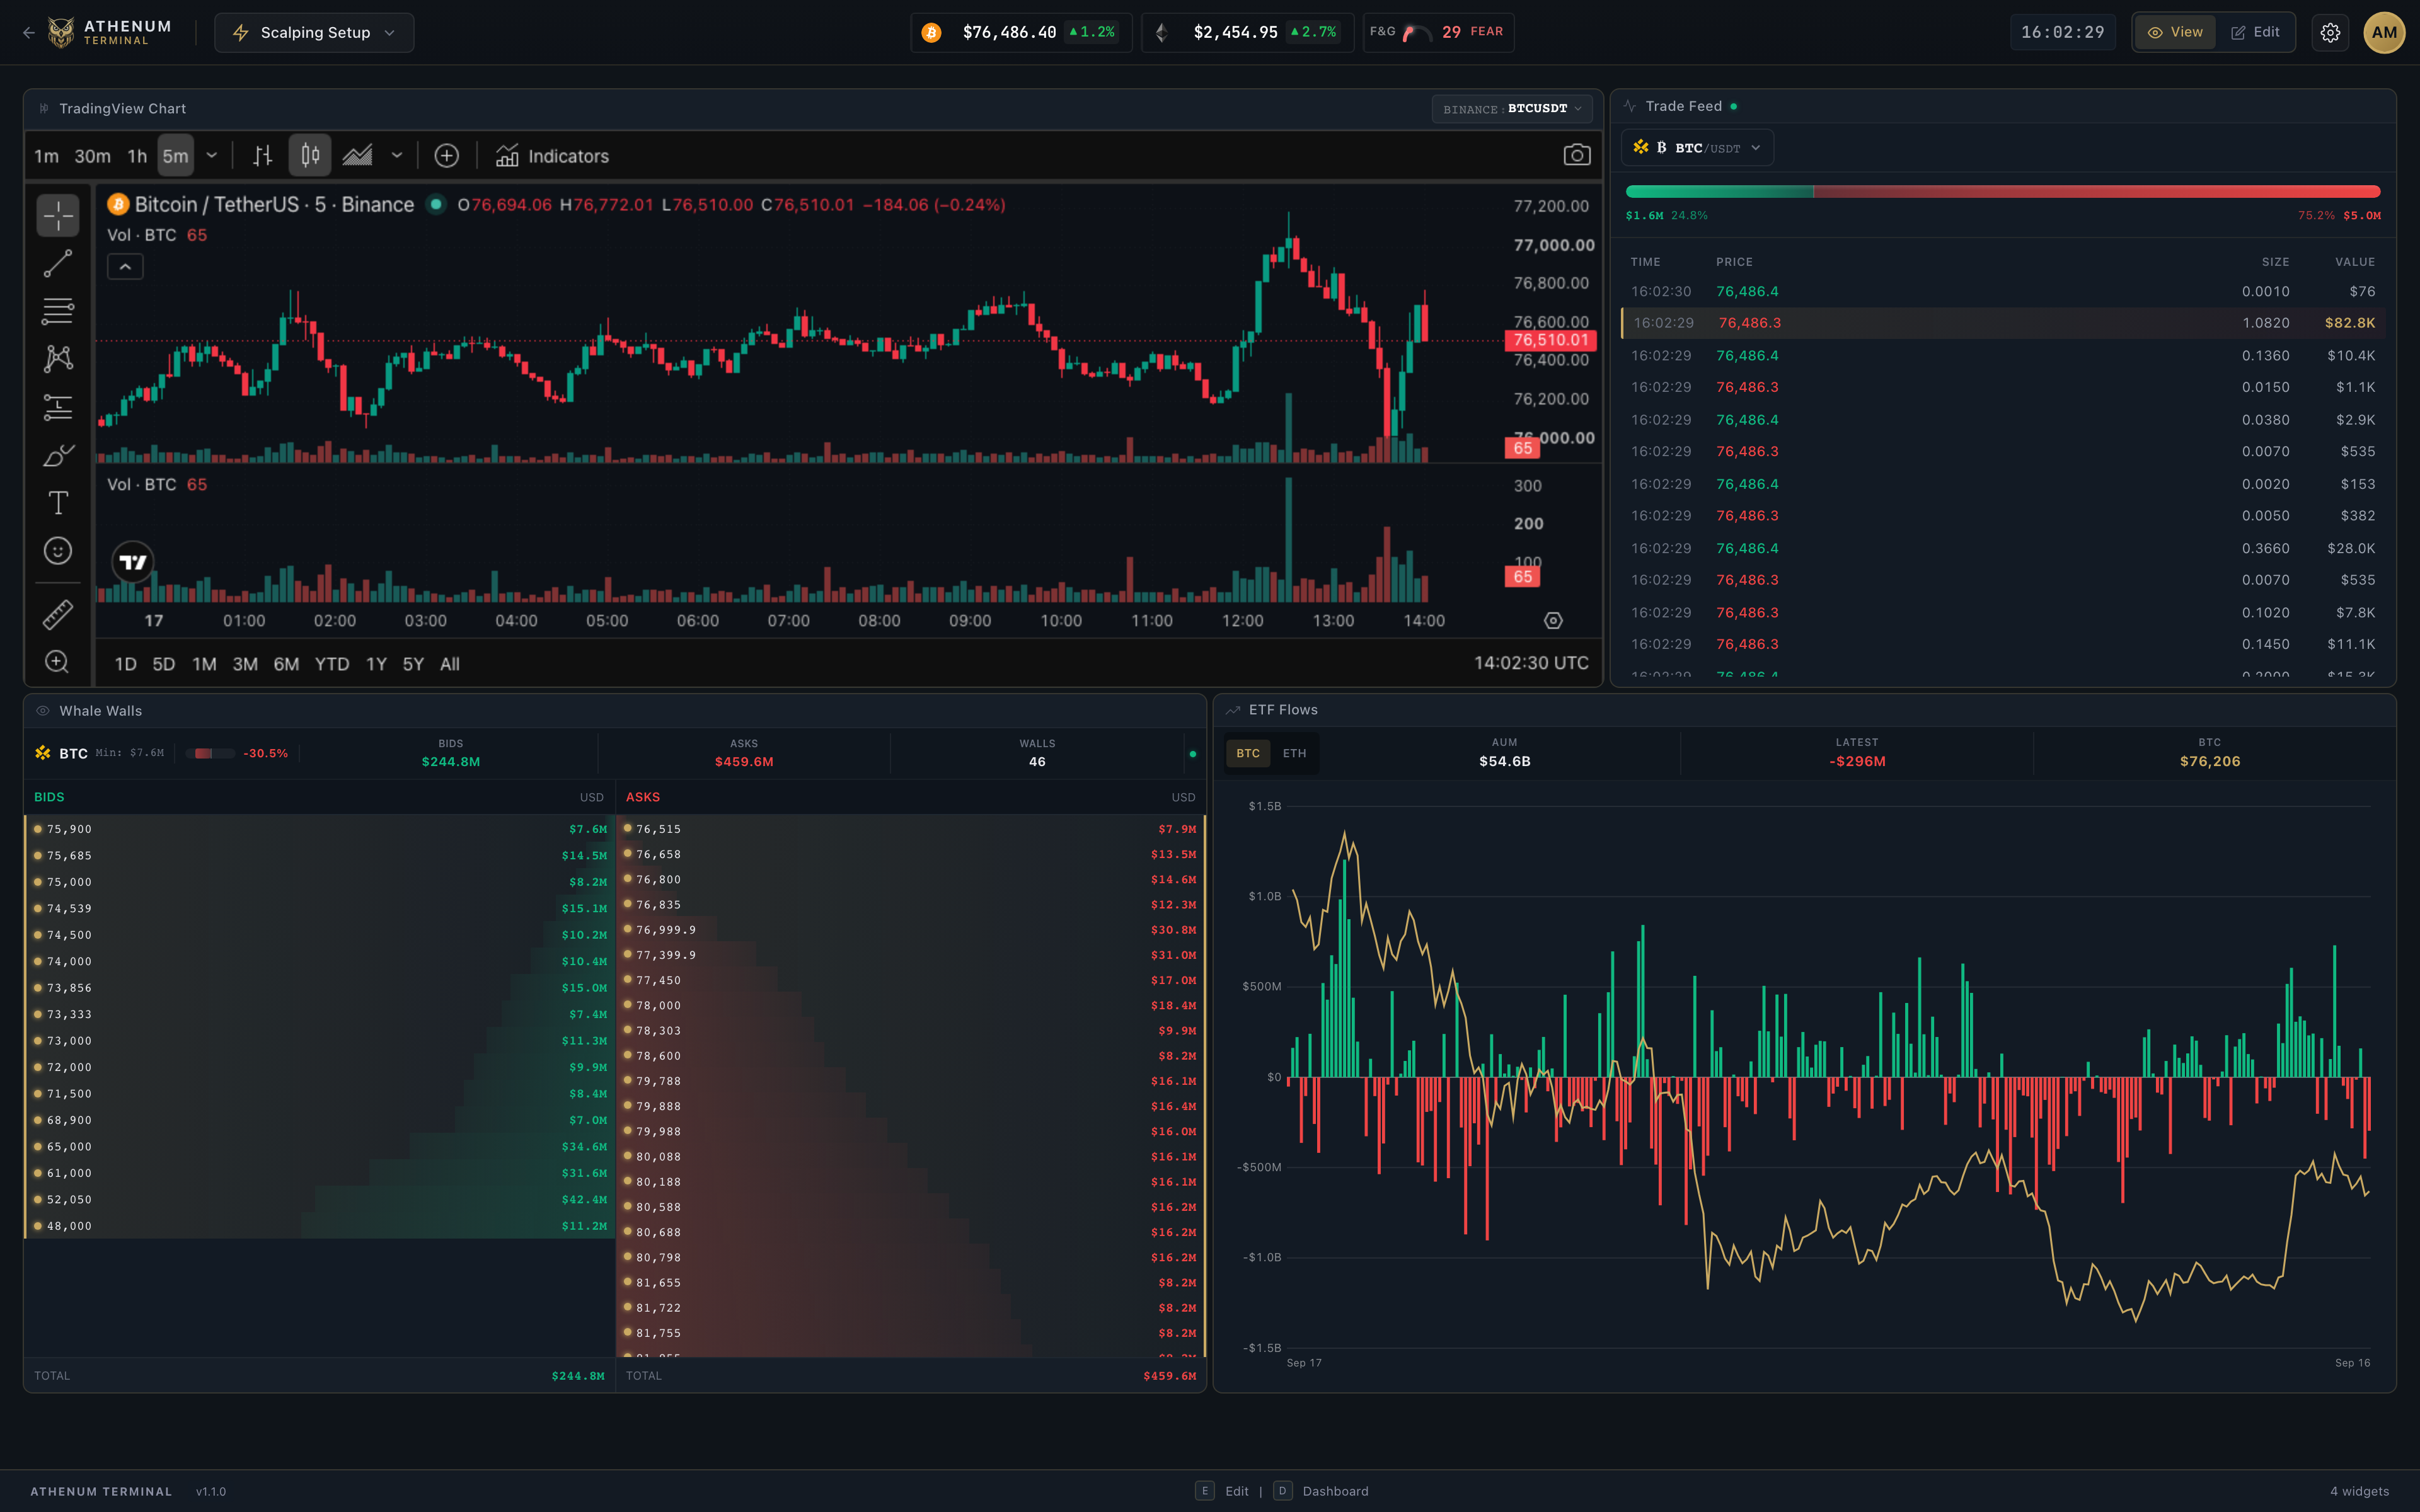
Historical Athenum terminal workspace with a BTC chart, Session Returns, Correlation Matrix, Hourly Returns Heatmap, liquidations and Trade Feed
Historical capture · Sep 23, 2026

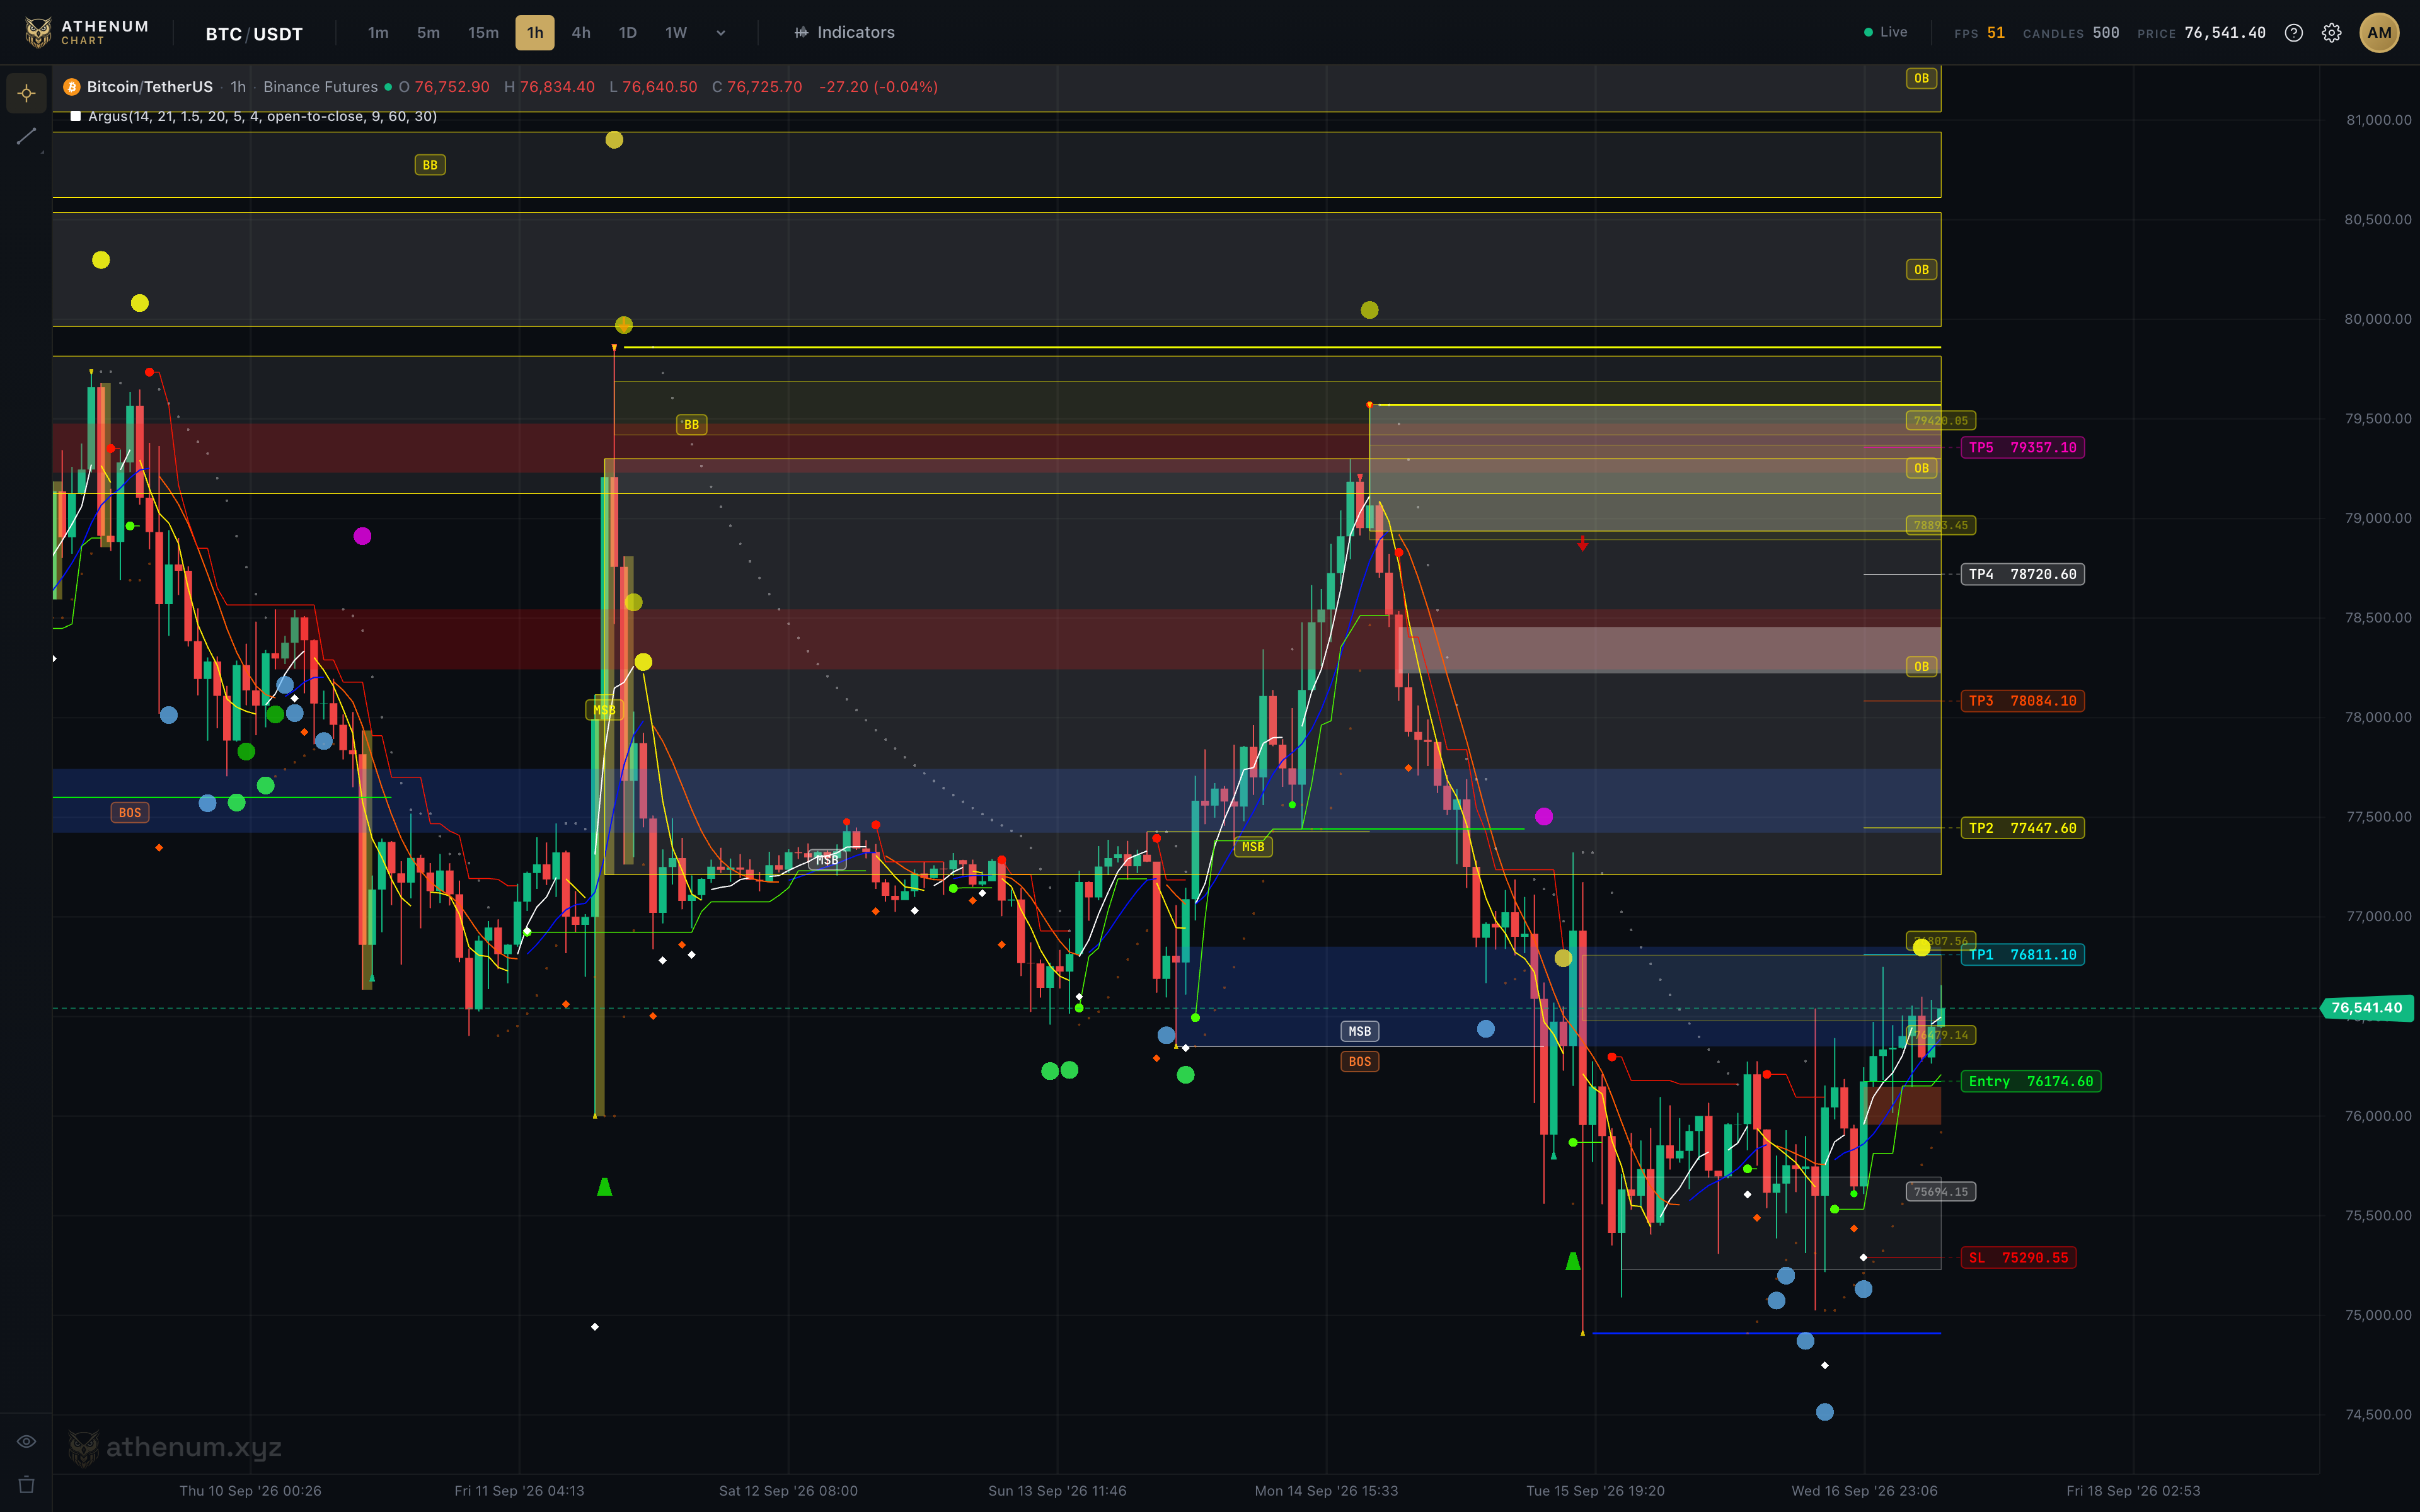
02Argus

See the market structure.

Explore structure breaks, order blocks and key price zones.

Historical Athenum Argus chart for BTC/USDT with market structure markers, order blocks and price zones
Historical capture · Sep 17, 2026

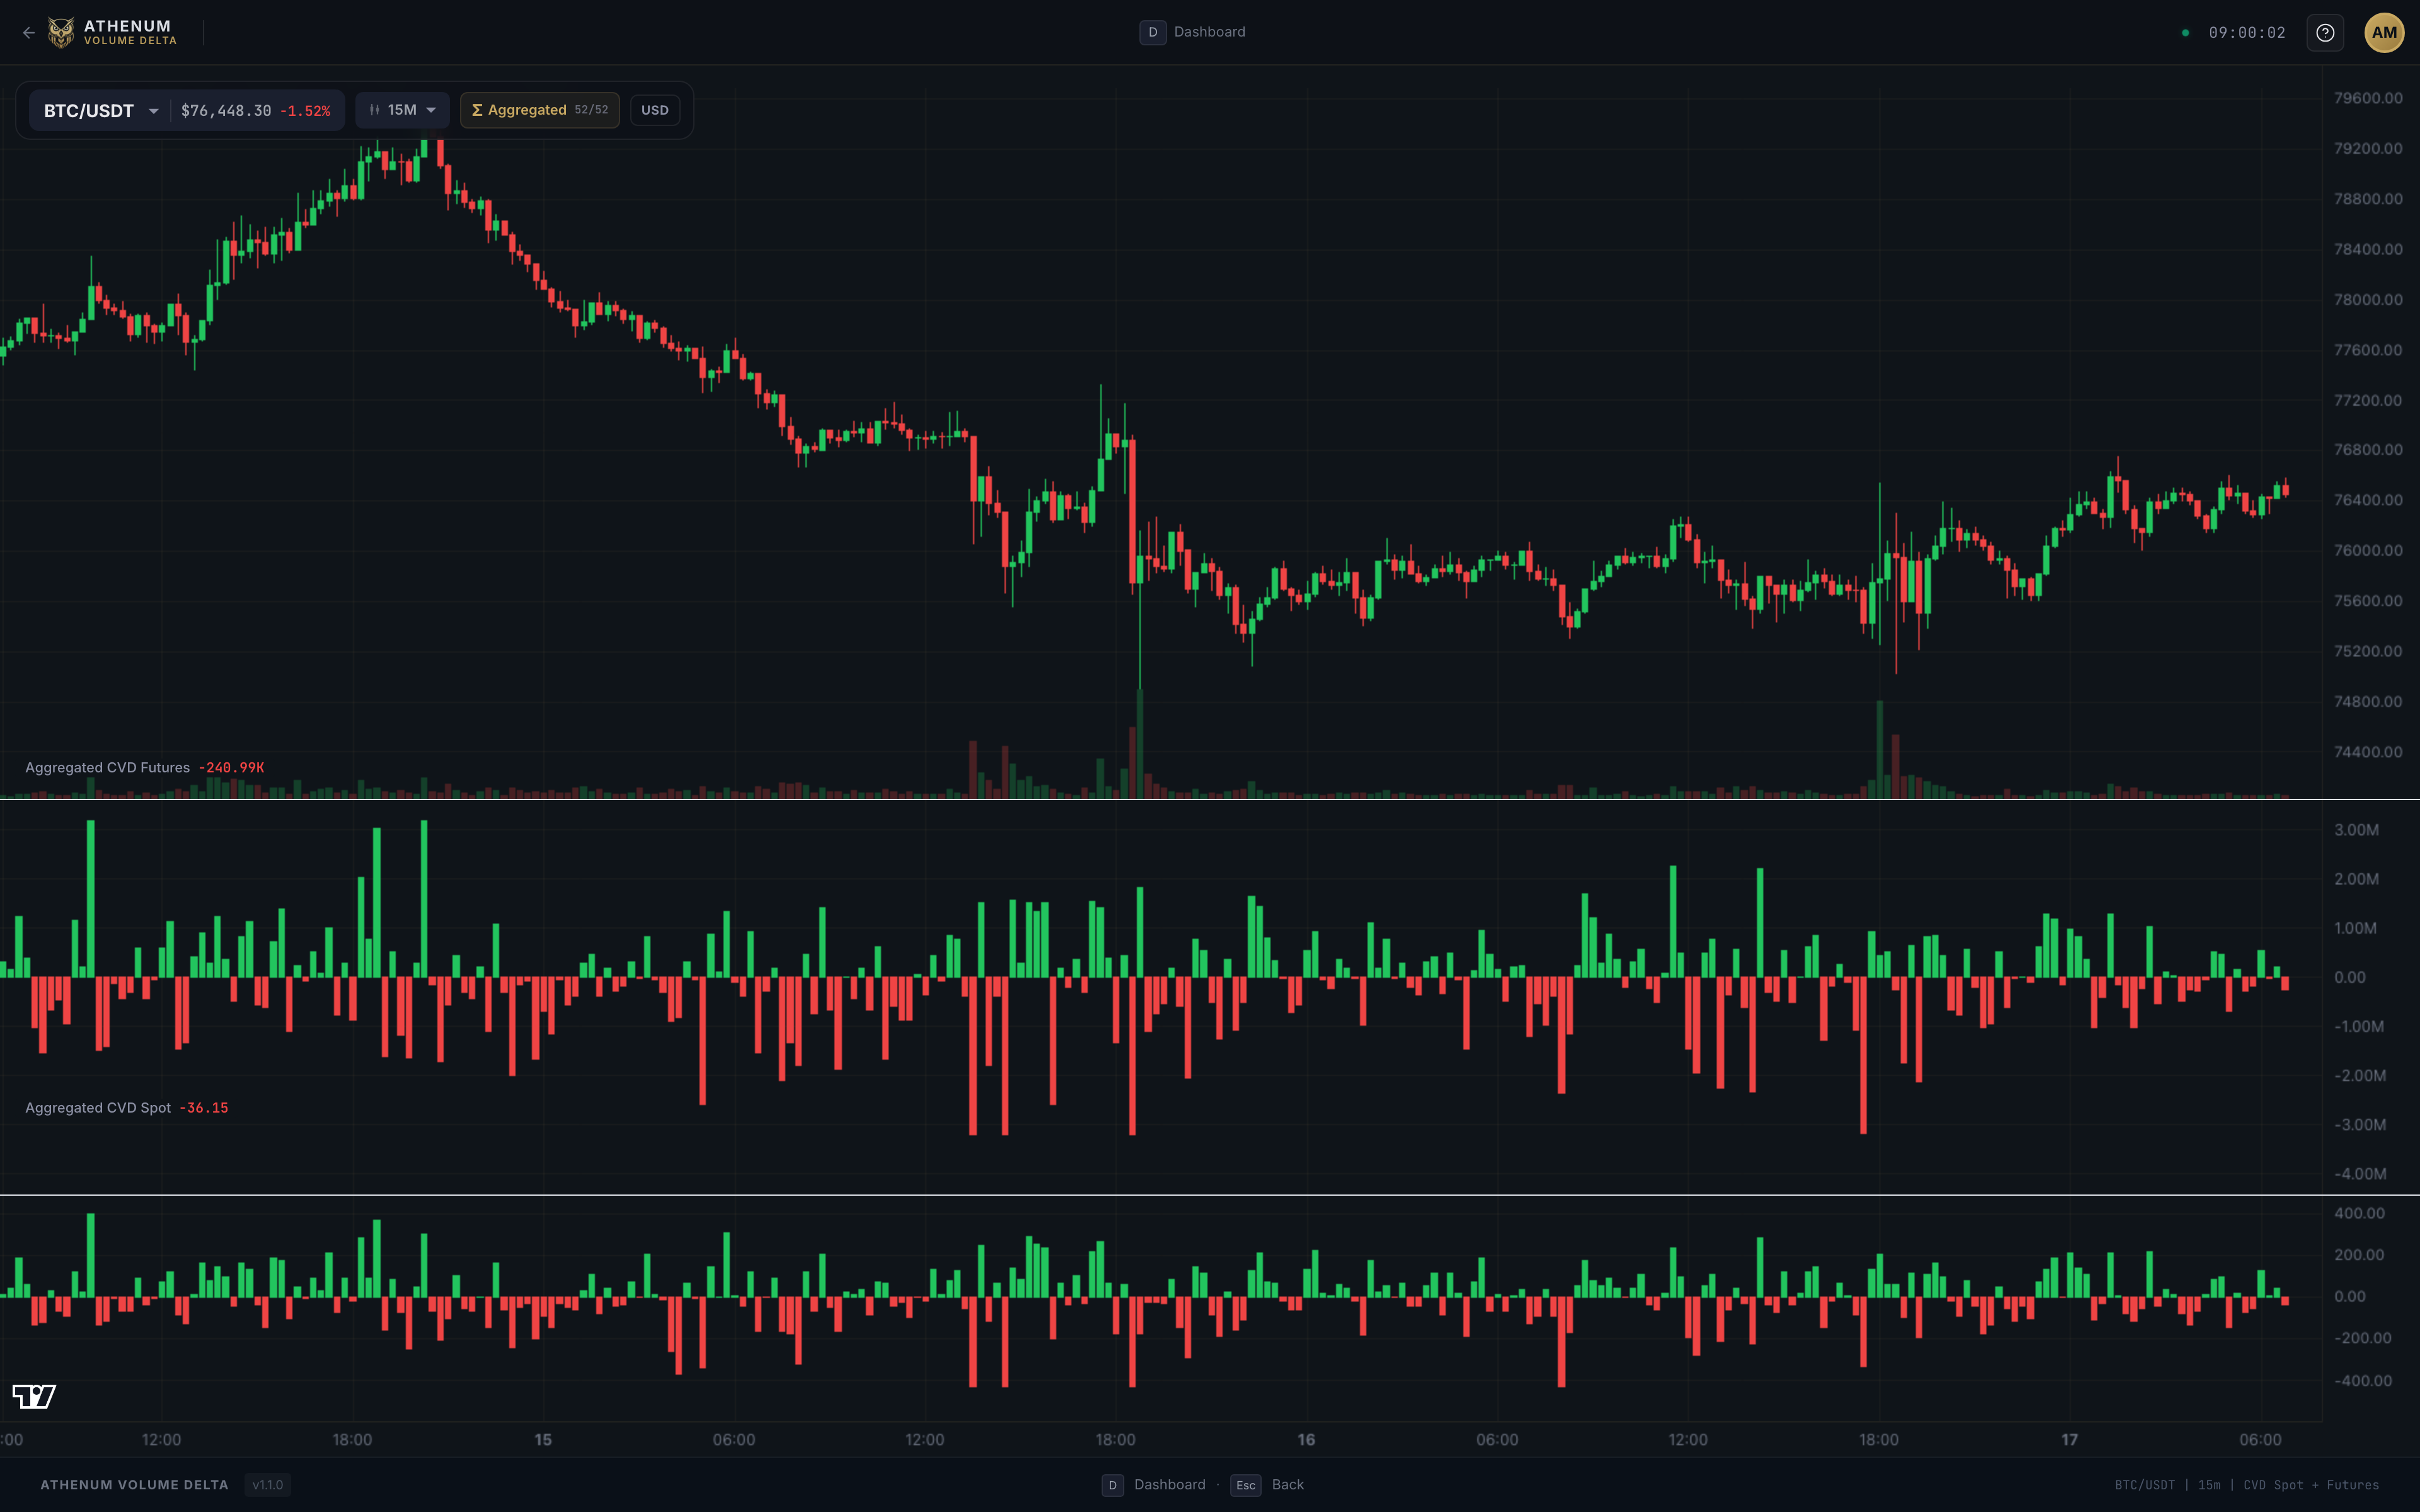
03Volume Delta

See the trading pressure.

Compare spot and futures buying and selling pressure alongside BTC price.

Historical Athenum Volume Delta capture showing the BTC price and separate futures and spot views
Historical capture · Sep 17, 2026
Historical Athenum terminal workspace with a BTC chart, Session Returns, Correlation Matrix, Hourly Returns Heatmap, liquidations and Trade Feed
Historical capture · Sep 23, 2026
01 / 03 · Terminal

Authentic product views, captured separately. Historical data, not live values. The captures illustrate a research workflow and are not synchronised in time.

Market data for your own tools.

The Athenum API is still in development. It is planned for Pro+ and will bring market data into your own dashboards and research.

  • Orderbook
  • Liquidations
  • Open Interest
  • Whale Positions
  • Funding
  • Macro Data
  • TradeFi
  • Prediction Markets
  • ETF Flows
  • Options
  • Price History
  • Volume Delta
Athenum API
Your application
Compare plan details

The diagram groups product datasets; it is not a list of available or guaranteed endpoints. Endpoints, limits and the launch date will be published in the documentation once the API is released. Trial accounts cannot create API keys.

WHY ATHENUM

Built around connected research.

Market research often means moving between charts, economic releases and exchange data. Athenum brings those views into one workspace so you can compare their evidence and limitations.

Legal Notice

ONE WORKSPACE. YOUR PERSPECTIVE.

Start curious.
Go deeper.

From your first market view to all five analysis domains.
Find the plan that fits the way you research.

Start with 7 days of Pro+. No credit card required.

One 7-day trial per user, after email verification. No API keys during the trial. It ends without an automatic charge; you can then choose a paid plan or continue with Free.

Explore

Free

Explore selected core tools

$0/mo

Free access to get started

Create a free account
1 analysis domain
  • Delayed data; no real-time entitlement
  • 1 venue per feature
  • Up to 24 hours of history
All features & domains

Choose Order Flow or Derivatives, with selected core tools and the Free limits below.

  • 1 saved layout
  • Delayed data; no real-time entitlement
  • 1 venue per feature
  • Up to 24 hours of history
  • ETHUSDT · 1h, 4h and 1d intervals
  • No alerts
  • Email and community support
How the domains work
Focus

Lite

Focus on one analysis domain

$27/mo

Billed monthly · USD

Choose Lite
1 analysis domain
  • Real-time access where the source supports it
  • Up to 5 venues per feature
  • Up to 48 hours of history
All features & domains

Choose Order Flow or Derivatives, with selected core tools. The plan does not include every feature in that domain.

  • Real-time access where the source supports it
  • Up to 5 venues per feature
  • Up to 48 hours of history
  • 3 saved layouts
  • Argus v1 · Whale notifications planned
  • Full symbol and interval catalog for available tools
  • Email and community support
How the domains work
Connect

Pro

Combine three analysis domains

$97/mo

Billed monthly · USD

Choose Pro
3 analysis domains
  • 3 analysis domains
  • All supported venues per feature
  • Up to 1.5 years of history
All features & domains

Order Flow + Derivatives, plus one of: Macro & Data, Macro Intelligence or TradeFi.

  • 3 analysis domains
  • All supported venues per feature
  • Up to 1.5 years of history
  • 10 saved layouts
  • Macro alerts · Whale notifications planned
  • Advanced indicators · Argus except v4
  • Advanced prediction-market signals
  • Email and community support
How the domains work

The current Founder offer prices Pro+ at $37/month instead of the standard $297. That is why Pro+ currently costs less than Pro. Monthly billing only; the Founder price is retained while the subscription stays active.

Compare plan details

These are plan ceilings, not guaranteed data coverage. Available history can be shorter; exchanges, symbols and refresh rates depend on the tool and source. Free and Lite include selected core tools in their chosen domain. Whale push and email notifications in account settings are still planned; they are not part of the currently configurable features. The Athenum API is still in development and planned for Pro+; it is not available yet. Commercial data exports are a Pro+ entitlement, but there is no separate export feature yet; CSV downloads built into individual tools are independent of it.

Six product areas. Five analysis domains.

The six perspectives above group the product by research question. Billing uses five domains: Order Flow, Derivatives, Macro & Data, Macro Intelligence and TradeFi. The Macro perspective spans the two macro domains.

World Map and the basic Prediction Markets workspace are platform views, not extra domain choices. Advanced prediction-market signals require Pro or Pro+. Individual module releases and data limits still apply.

Paid domain selections are fixed until the next selection window: the next billing date for monthly plans, or the first of the next calendar month (UTC) for annual plans.

How the domains work
FAQ

Frequently Asked Questions

Everything you need to know about the platform, security, and pricing.

Still have questions?
What is Athenum?

Athenum is a multi-asset analytics terminal for traders and analysts. It connects order flow, derivatives, macro data, prediction markets and geopolitical context. The product views show the actual platform; individual modules may have different availability.

How do the views work together?

Use macro series and events to frame a question, then examine positioning, executed trades and resting orders. The shared workspace makes comparison easier; a correlation or marked price zone is not a trading signal by itself.

What does Athenum cost?

You can use the free trading calculators without an account and try Pro+ for 7 days without a credit card. Paid access is available through Lite, Pro and Pro+. The plan comparison above shows current monthly and annual prices, included domains and any active founder offer. One 7-day trial per user, after email verification. No API keys during the trial. It ends without an automatic charge; you can then choose a paid plan or continue with Free.

Do I need to connect an exchange account?

No exchange connection is required to explore the public market data, charts and analytics shown here. The analytics workspace does not need permission to access your funds.

Is the same data available for every exchange?

Coverage depends on the exchange, instrument and tool. Order books, derivatives, options and macro data use different sources. Check the selected market and source in the relevant view; not every venue provides every dataset.

Does Athenum work on my phone?

The terminal is designed for desktop browsers and a multi-panel layout. Mobile is useful for quick checks; complex charts and research views work best on a larger screen. Availability also depends on browser and graphics support.

Can I cancel if it's not for me?

You can manage and cancel your subscription in your account settings. Access continues for the remainder of your paid billing period. The billing documentation explains renewals and cancellation. No credit card is required for the 7-day trial.

Free Tools

A useful place to start. Free.

Size a position, calculate leverage or model funding costs. Our trading calculators work without an account.

Explore all free tools
Learn

Free Crypto Trading Courses

Build a process you can check. Start with risk and execution, then work through the evidence behind derivatives and order-flow signals. Each lesson includes a calculation or case study, a failure case and a practice question.

20 courses · 100 lessons · 7 languages

All courses
Latest Research

From the Blog

View all articles
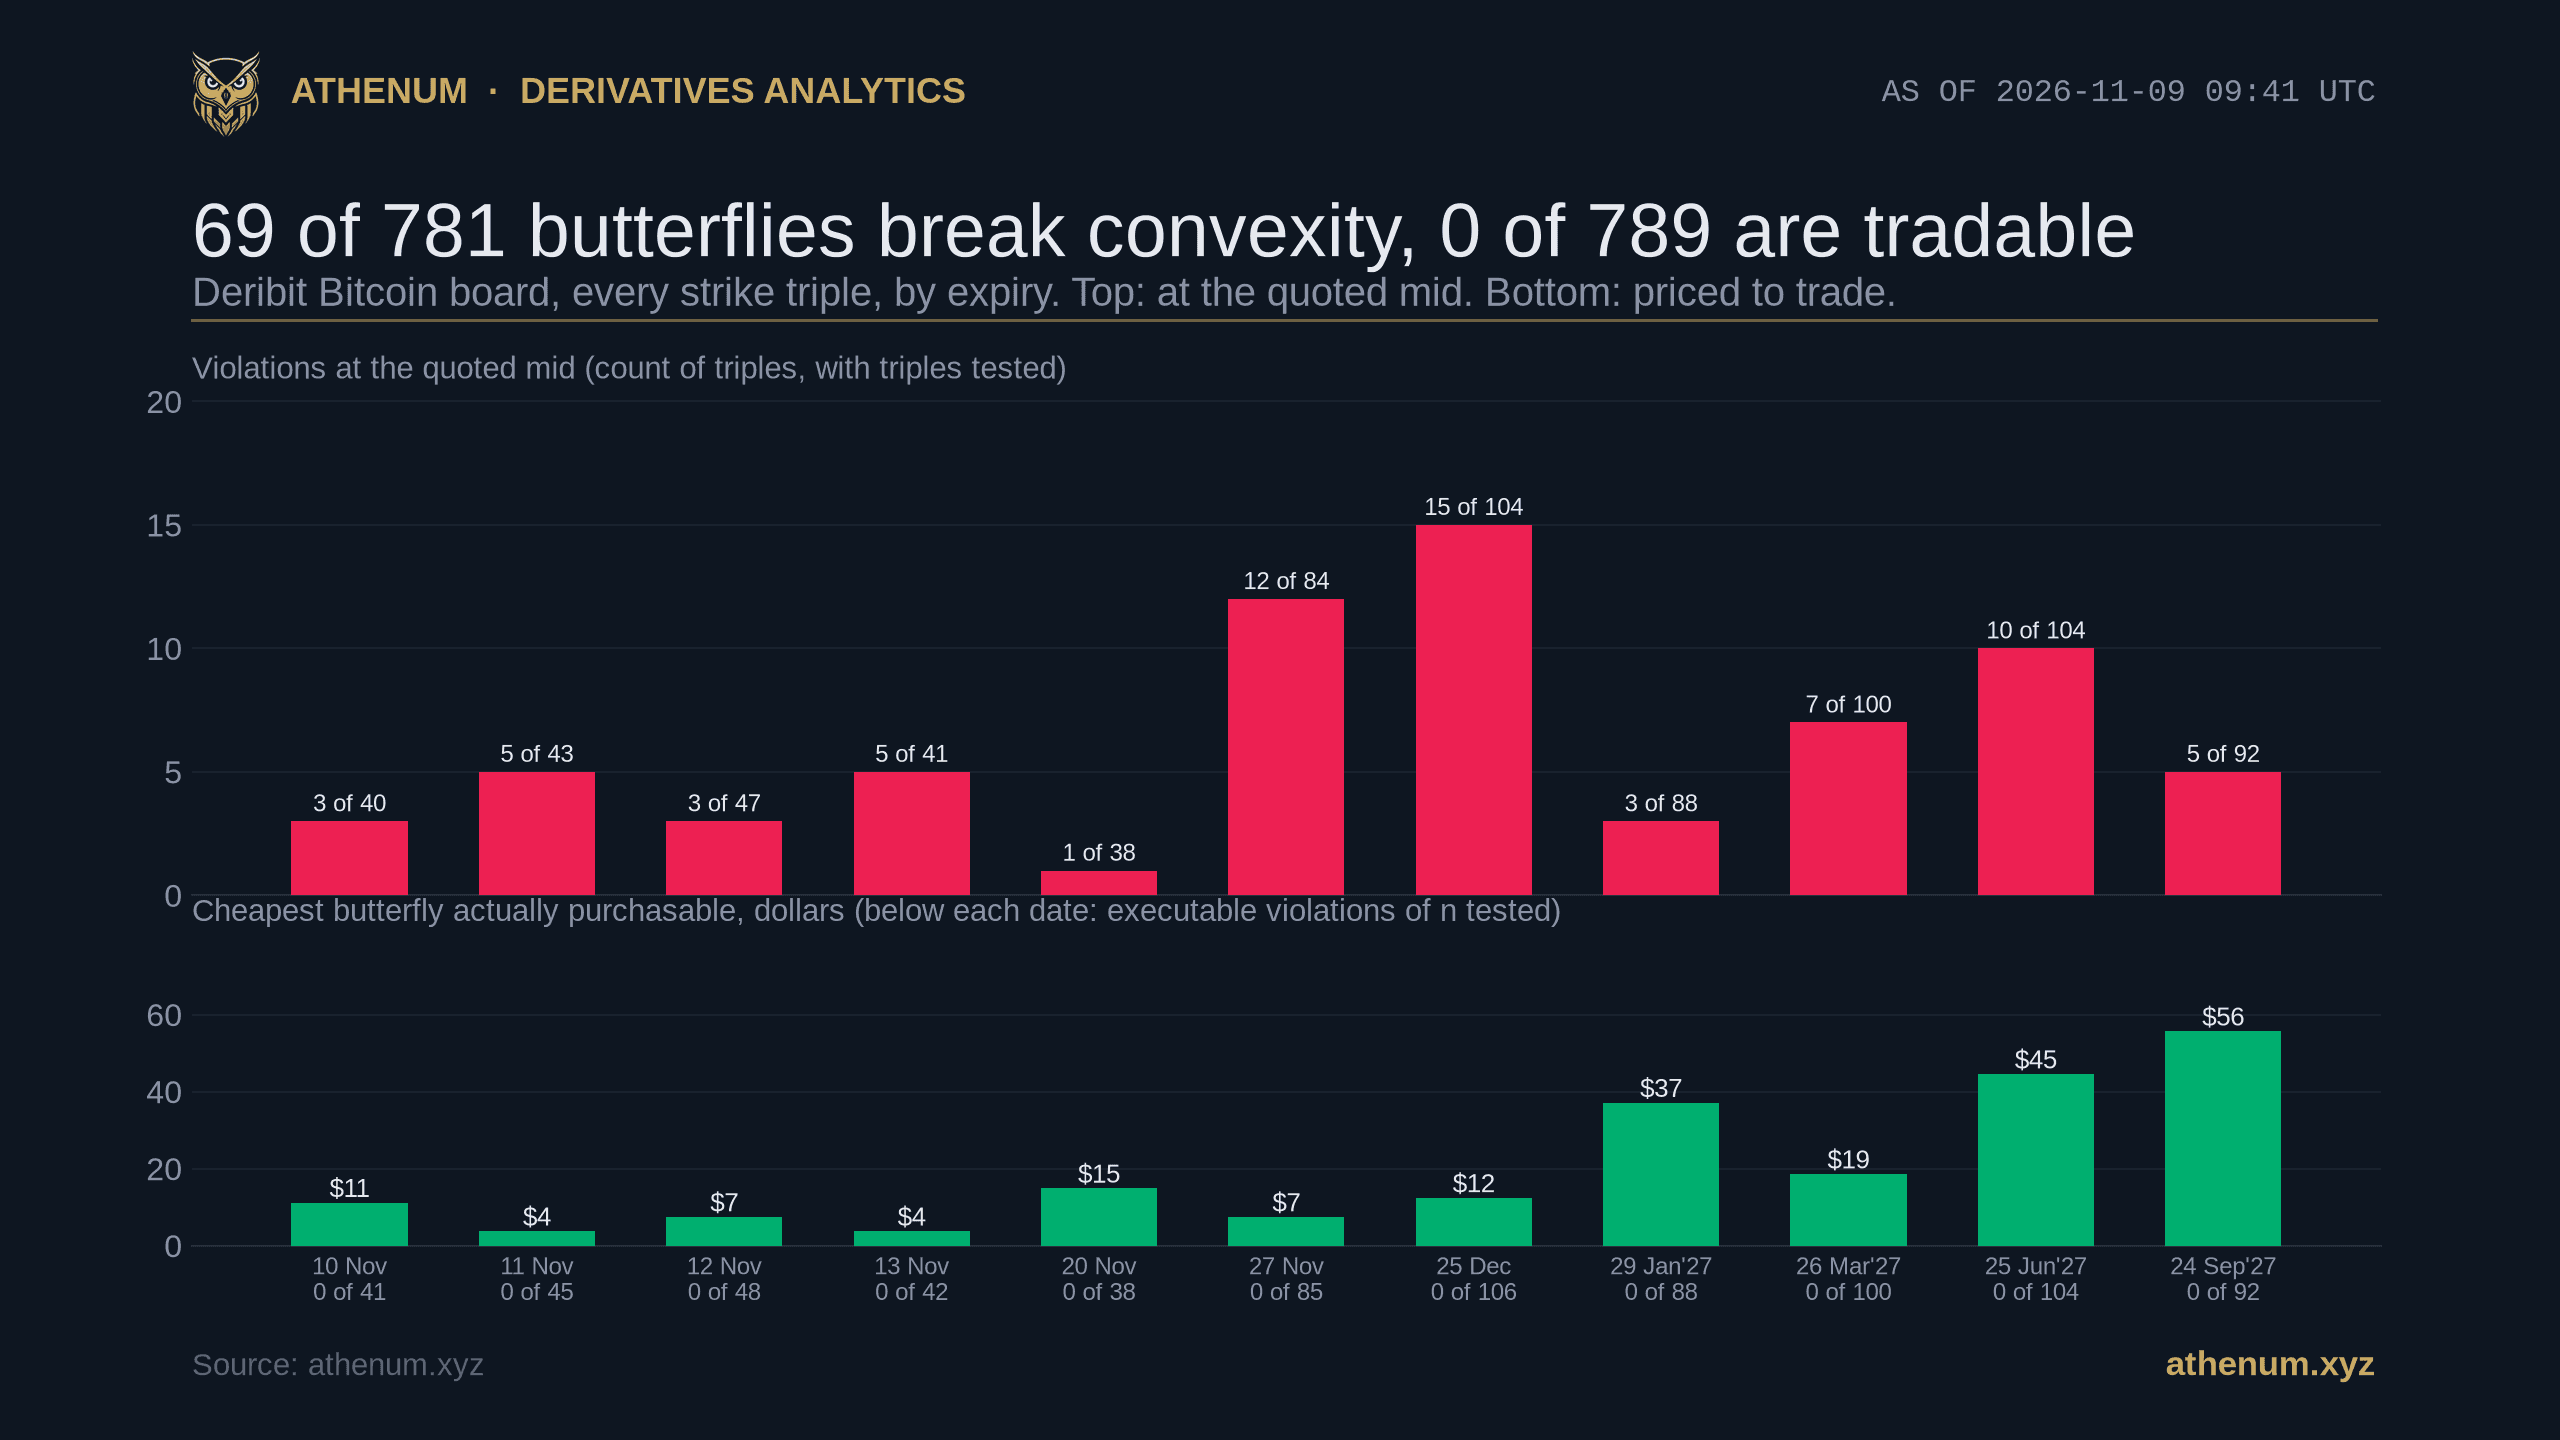
Two panel chart of the live Deribit Bitcoin option board on 2026-11-09 at 09:41 UTC. The top panel counts convexity violations at the quoted mid by expiry, from 1 of 38 on 20 November to 15 of 104 on 25 December, 69 of 781 in total. The bottom panel shows zero executable violations in every one of the 11 expiries and the cheapest purchasable butterfly, from 4 dollars on 11 and 13 November to 56 dollars on 24 September 2027.

Bitcoin Option Convexity: 69 Impossible Butterflies on Deribit, None You Can Trade

On 2026-11-09 at 09:41 UTC, 69 of 781 strike triples on the live Deribit Bitcoin option board break the convexity condition at the quoted mid, and 44 of those 69 are within two price increments. Priced to trade, 0 of 789 do.

Athenum AnalyticsAthenum Analytics
12 min
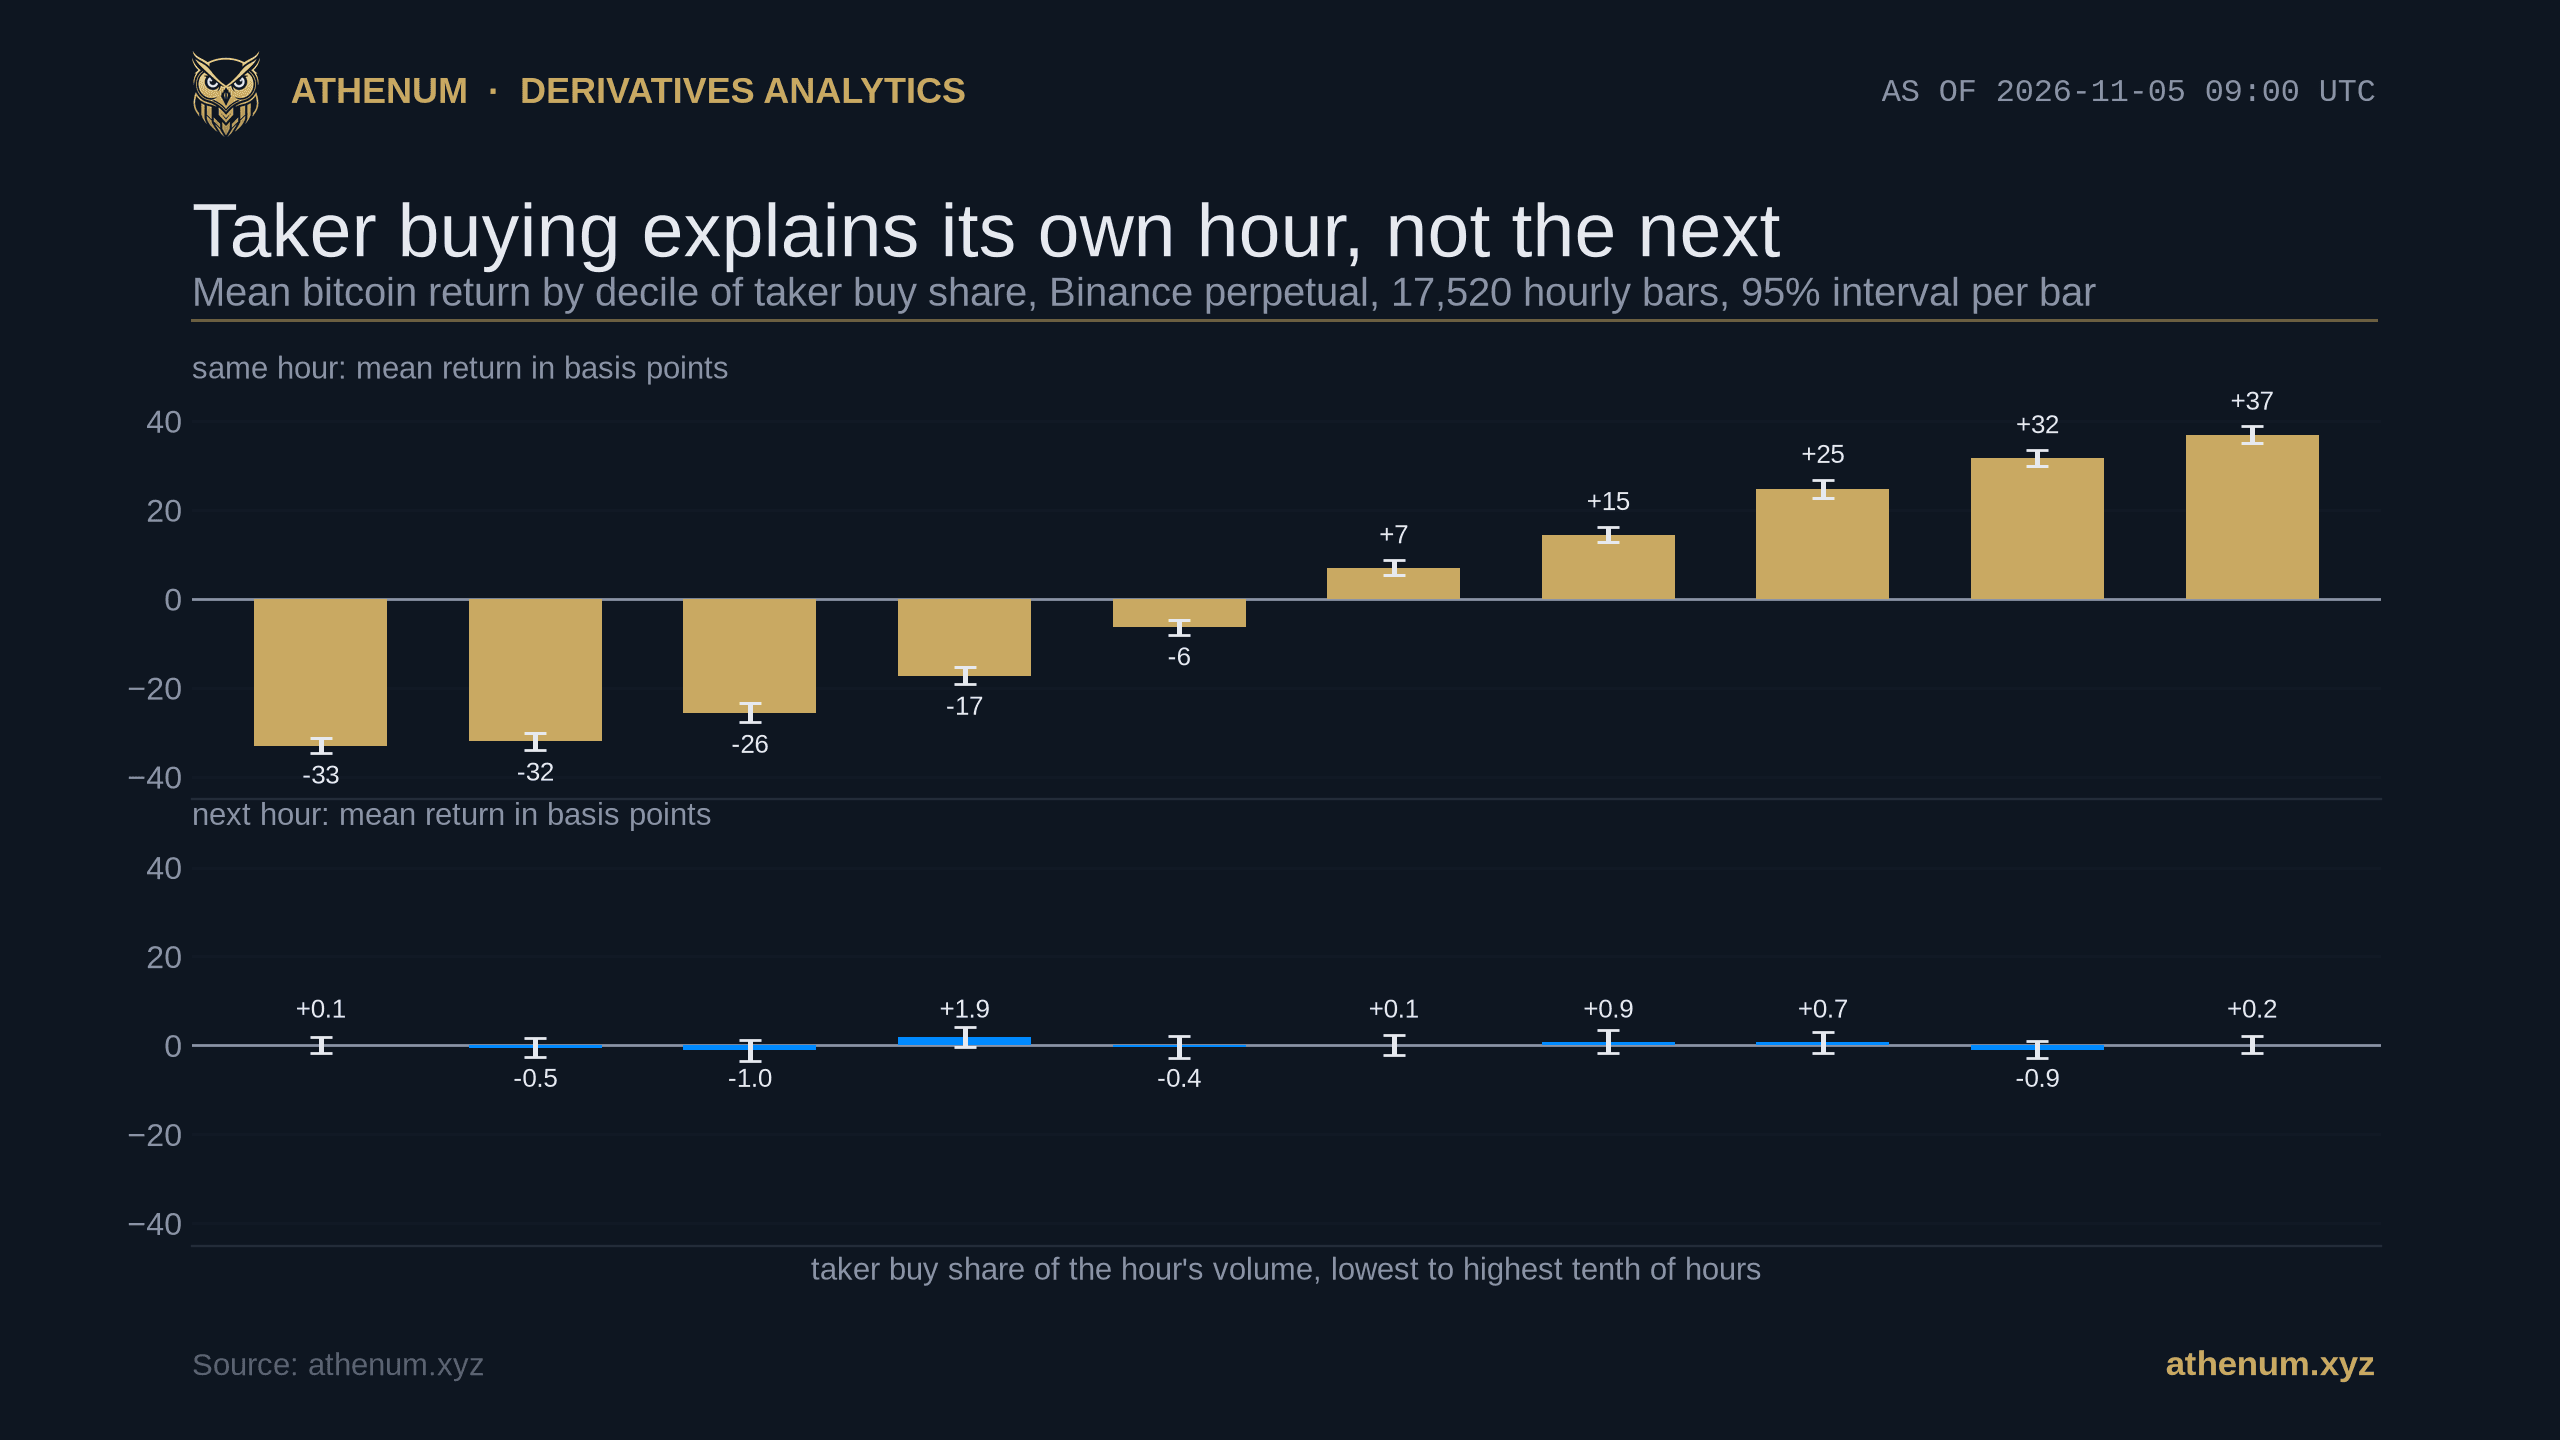
Two stacked bar panels of the mean bitcoin return by tenth of taker buy share on the Binance perpetual over 17,520 hourly bars from 2024-11-05 to 2026-11-05. Top panel, same hour: from minus 33 basis points in the lowest tenth of hours to plus 37 in the highest. Bottom panel, next hour: every bar between minus 1.0 and plus 1.9 basis points with 95 percent intervals that cross zero.

Bitcoin Taker Buy Sell Ratio: 0.49 Correlation With Its Own Hour, 0.00 With the Next

On the Binance bitcoin perpetual, an hour's taker buy sell imbalance correlates +0.49 with that hour's return and +0.003 with the next hour's, over 17,520 hours to 2026-11-05. The top tenth of buying hours returned +36.9 basis points, then +0.2.

Athenum AnalyticsAthenum Analytics
11 min
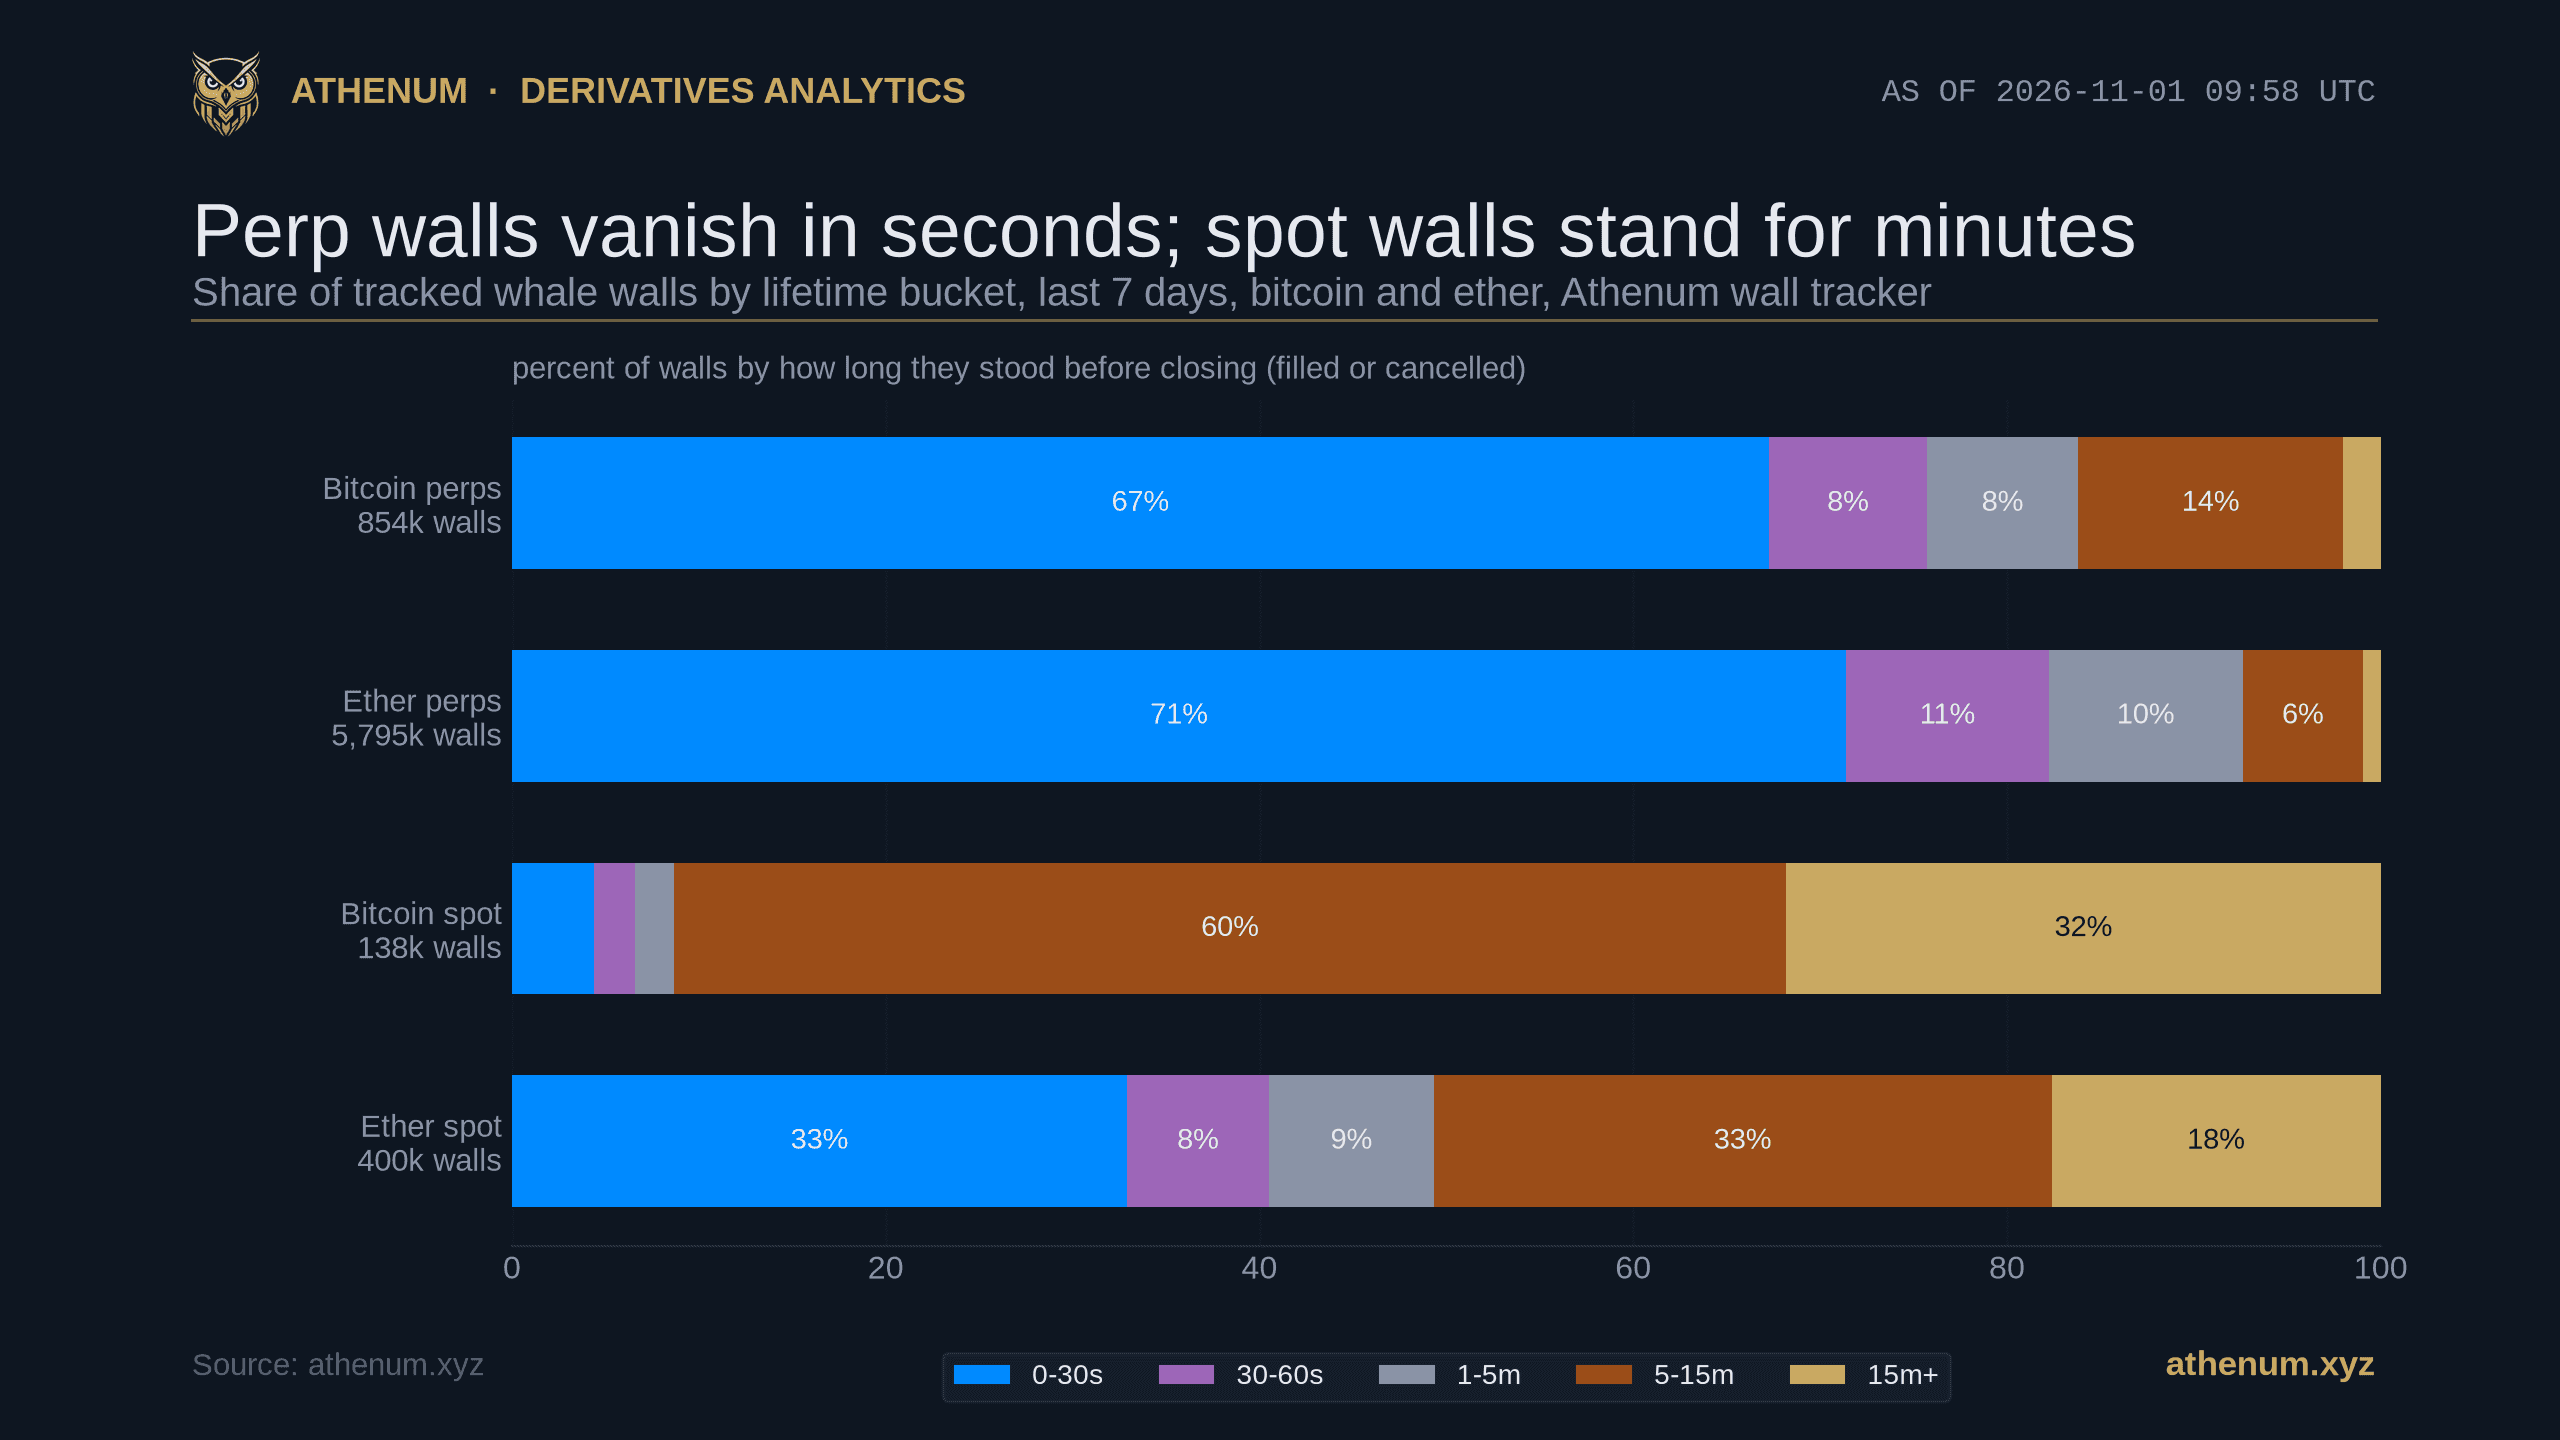
Horizontal 100 percent stacked bar chart of whale wall lifetime on 2026-11-01 at 09:58 UTC over the last 7 days, five buckets from 0 to 30 seconds up to 15 minutes or more: bitcoin perps 853 thousand walls with 67 percent under 30 seconds, ether perps 5,795 thousand walls with 71 percent under 30 seconds, bitcoin spot 138 thousand walls with 60 percent in the 5 to 15 minute bucket and 32 percent at 15 minutes or more, ether spot 400 thousand walls with 33 percent under 30 seconds and 33 percent in the 5 to 15 minute bucket.

Bitcoin Whale Wall Lifetime: 67 Percent of Perp Walls Close in 30 Seconds, Spot Walls Stand 13 Minutes

A whale wall is a large resting order, and how long it stands depends mostly on which market and which day you ask about. Read from Athenum's wall tracker on 2026-11-01 (09:55 to 09:59 UTC), the 853,673 bitcoin perpetual walls that closed in the last 7 days split 67.3 percent under 30 seconds and...

Athenum AnalyticsAthenum Analytics
15 min
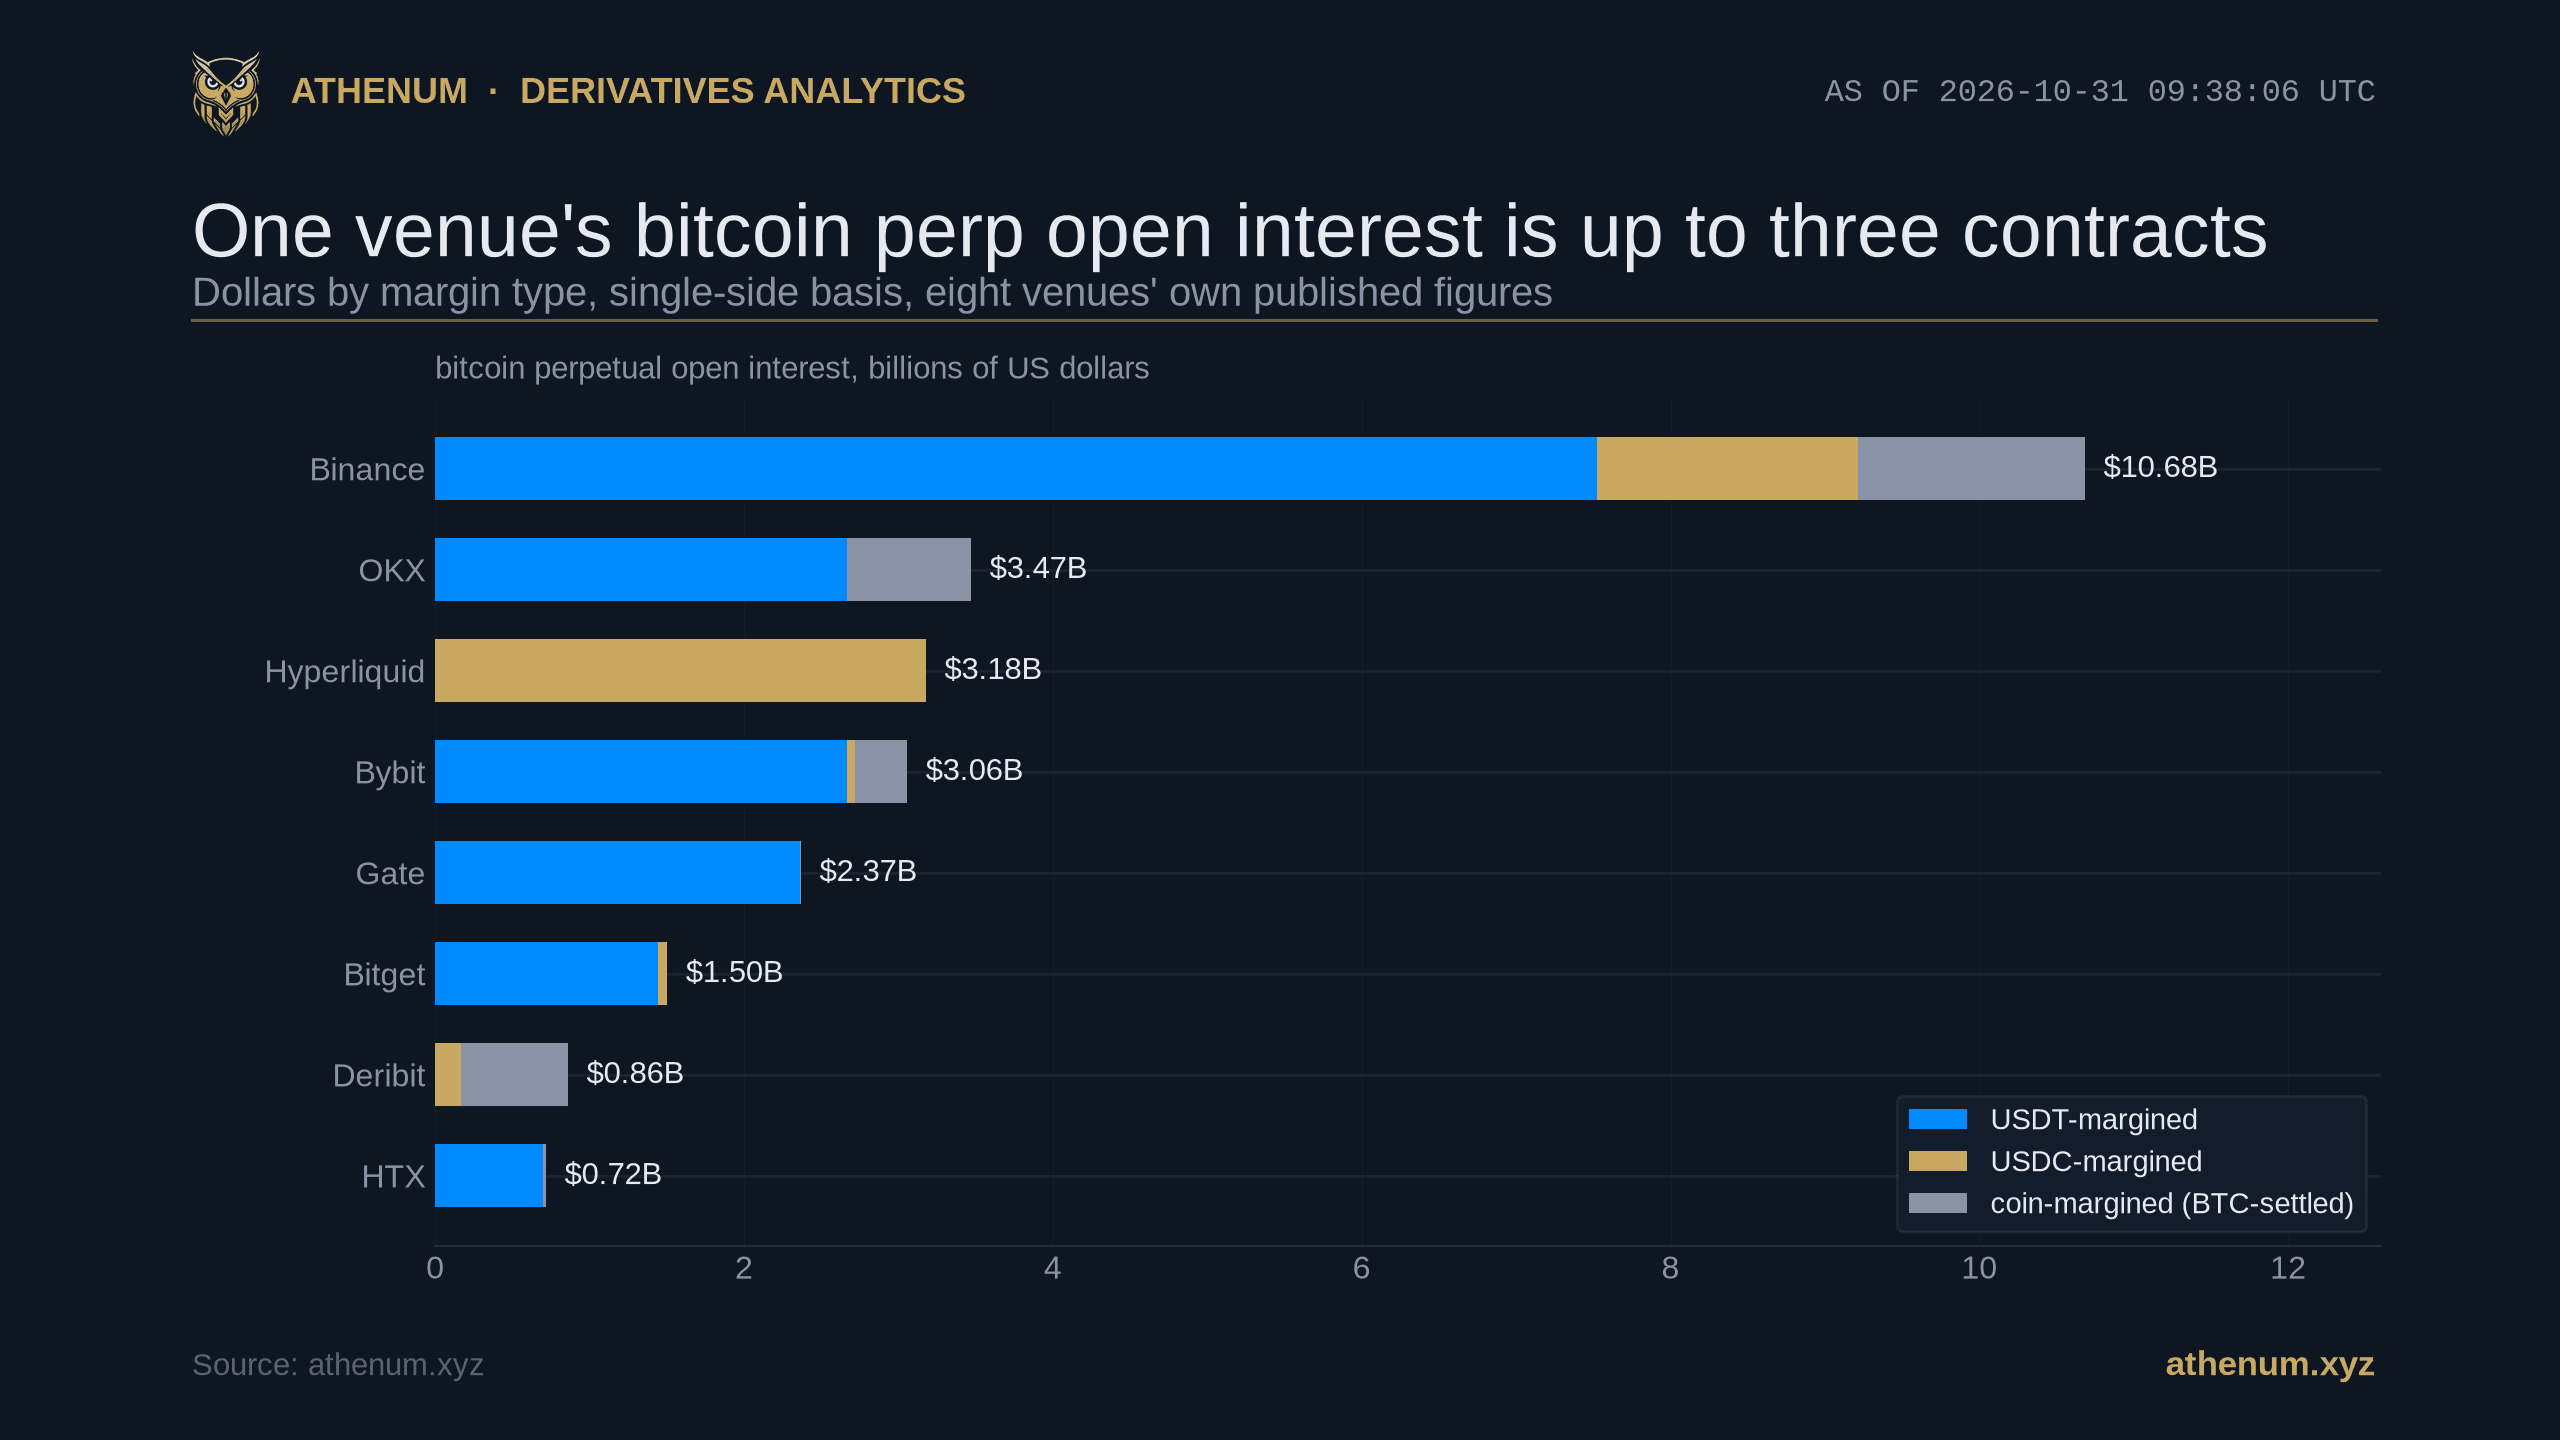
Horizontal stacked bar chart of bitcoin perpetual open interest by margin type for eight venues on 2026-10-31 at 09:38:06 UTC, single-side dollars: Binance 10.68 billion, OKX 3.47, Hyperliquid 3.18, Bybit 3.06, Gate 2.37, Bitget 1.50, Deribit 0.86, HTX 0.72, split into USDT-margined, USDC-margined and coin-margined segments

Bitcoin Open Interest by Margin Type: A USDT-Only Read Misses 30 Percent of Binance

"Bitcoin perpetual open interest on an exchange" is not one contract. Read from each venue's own public endpoint on 2026-10-31 (reads started 09:38:06 UTC), Binance's figure was $10.68B built from three contracts: $7.52B on the USDT-margined perpetual, $1.69B on the USDC-margined one and $1.47B on...

Athenum AnalyticsAthenum Analytics
12 min
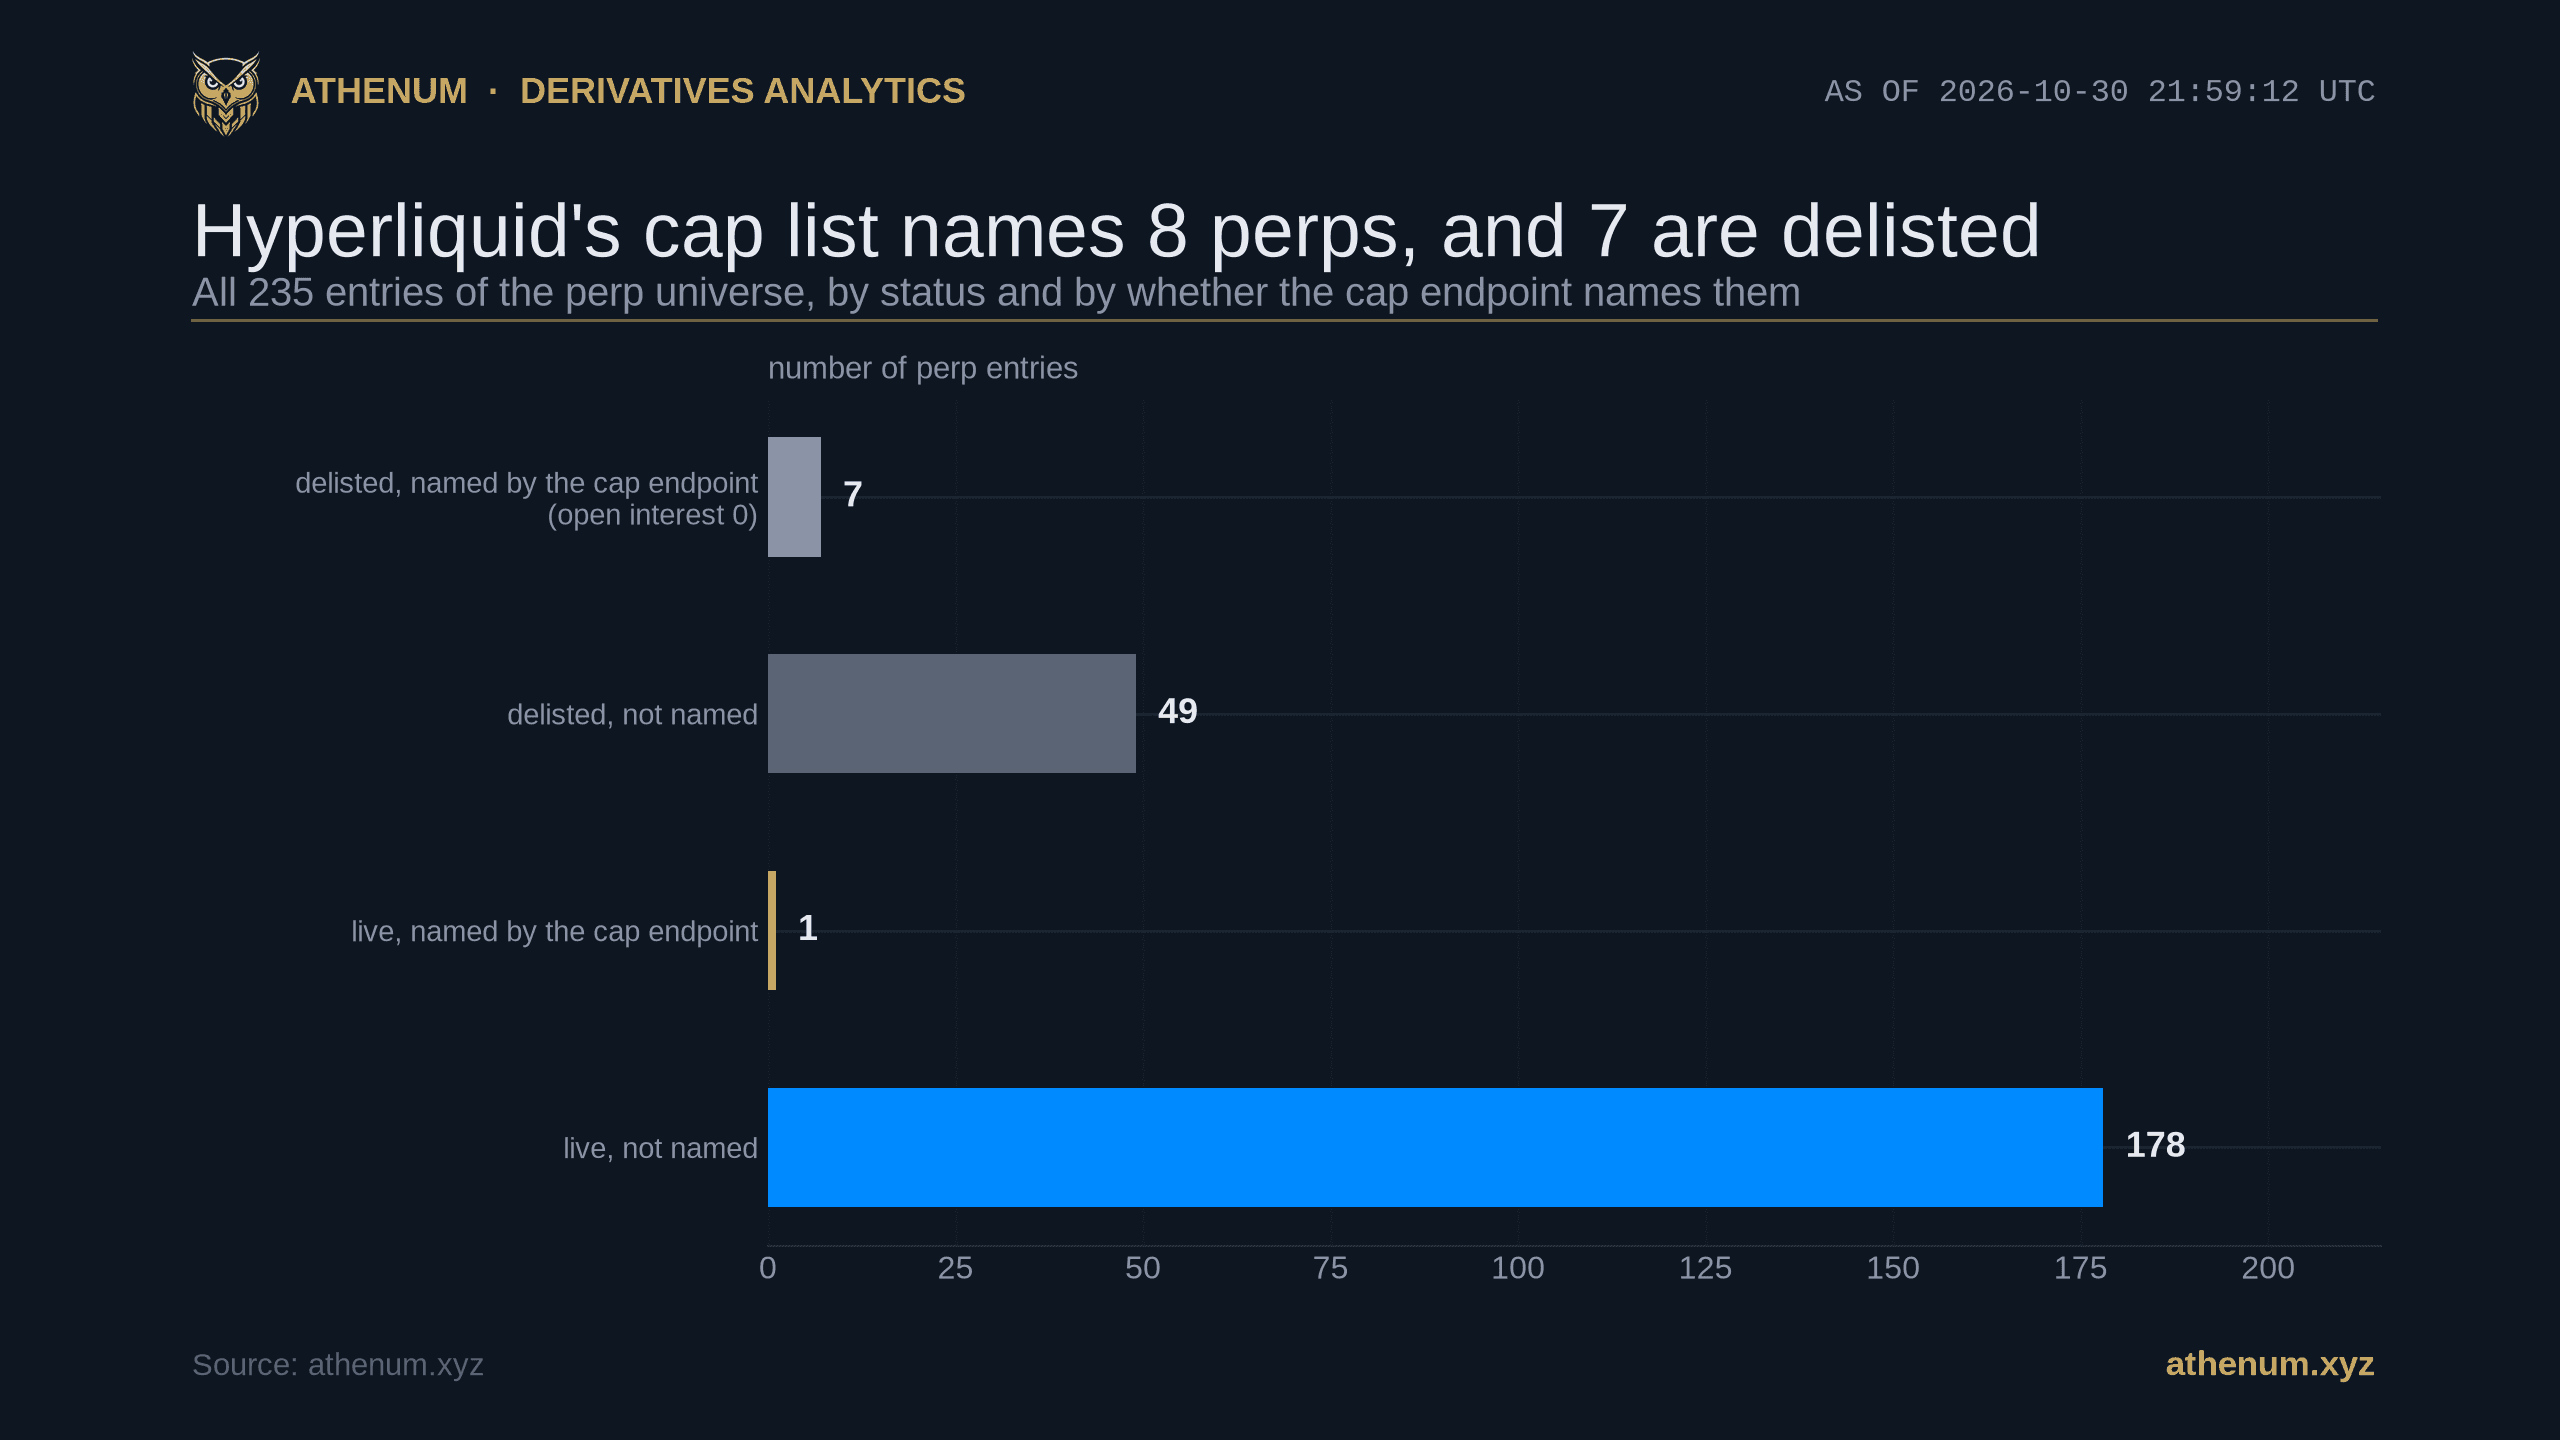
Horizontal bar chart of all 235 entries in Hyperliquid's perp universe on 2026-10-30 at 21:59:12 UTC by status: 7 delisted entries named by the cap endpoint, 49 delisted entries not named, 1 live entry named, and 178 live entries not named

Hyperliquid Open Interest Cap: Seven of the Eight Perps at It Are Delisted

Hyperliquid publishes a keyless endpoint, `perpsAtOpenInterestCap`, that lists the perpetuals which have hit their open interest cap, and a pipeline that counts its answer will be wrong. Read on 2026-10-30 at 21:59:12 UTC it returned 8 names: CANTO, FTM, JELLY, LOOM, RLB, SOPH, VINE and ZEREBRO....

Athenum AnalyticsAthenum Analytics
9 min
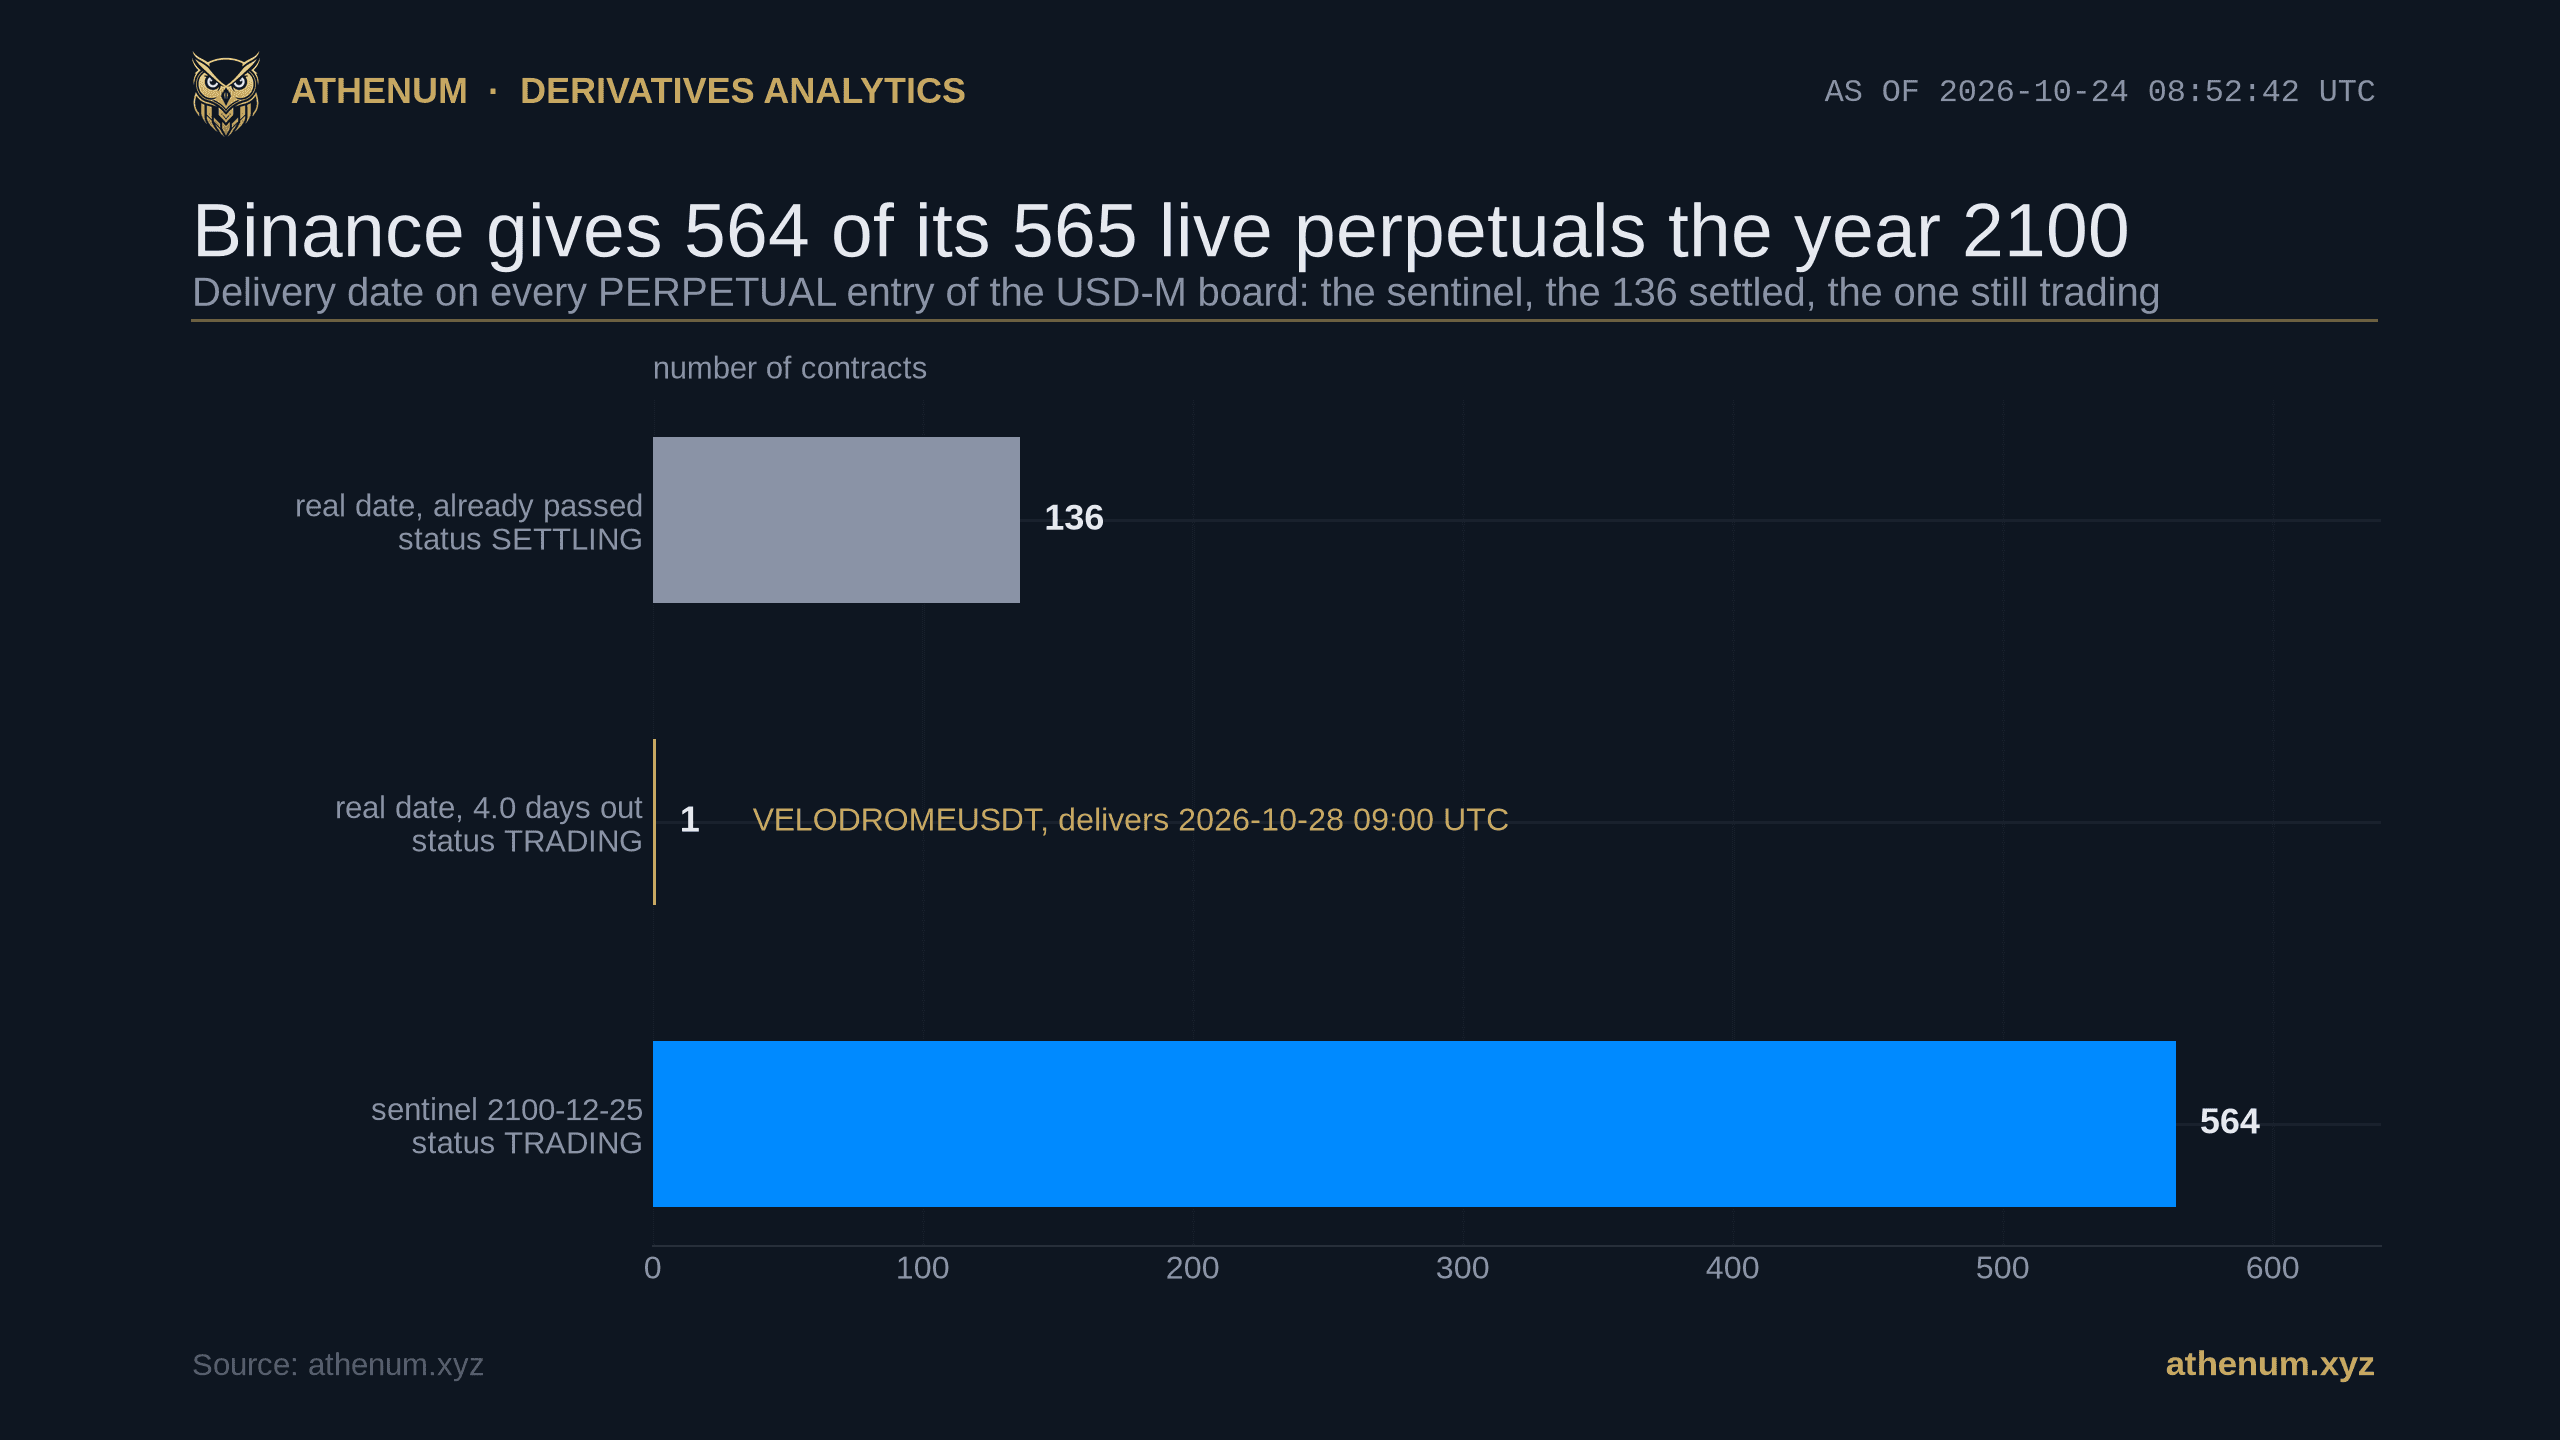
Horizontal bar chart of the delivery date carried by every PERPETUAL entry on Binance's USD-M board, read 2026-10-24 08:52:42 UTC. 564 trading contracts carry the sentinel 2100-12-25, one trading contract carries a real date four days out, and 136 settling contracts carry real dates already in the past

Perpetual Futures Expiry and the One Binance Contract That Has a Date

A perpetual futures expiry is supposed to be a contradiction in terms, and on Binance's USD-M board it almost is. Read keyless on 2026-10-24 at 08:52:42 UTC, that board carries 931 symbols, 702 of them labelled `PERPETUAL`. Of the 565 perpetuals currently trading, 564 carry the same delivery...

Athenum AnalyticsAthenum Analytics
10 min

See how it all connects.

Compare context, positioning and liquidity in your own research. Start with a 7-day Pro+ trial.

Start 7-day free trial 7 days of Pro+ · No credit card requiredActual product recording · Market data shown is historical