Blog
Page 4 of 10
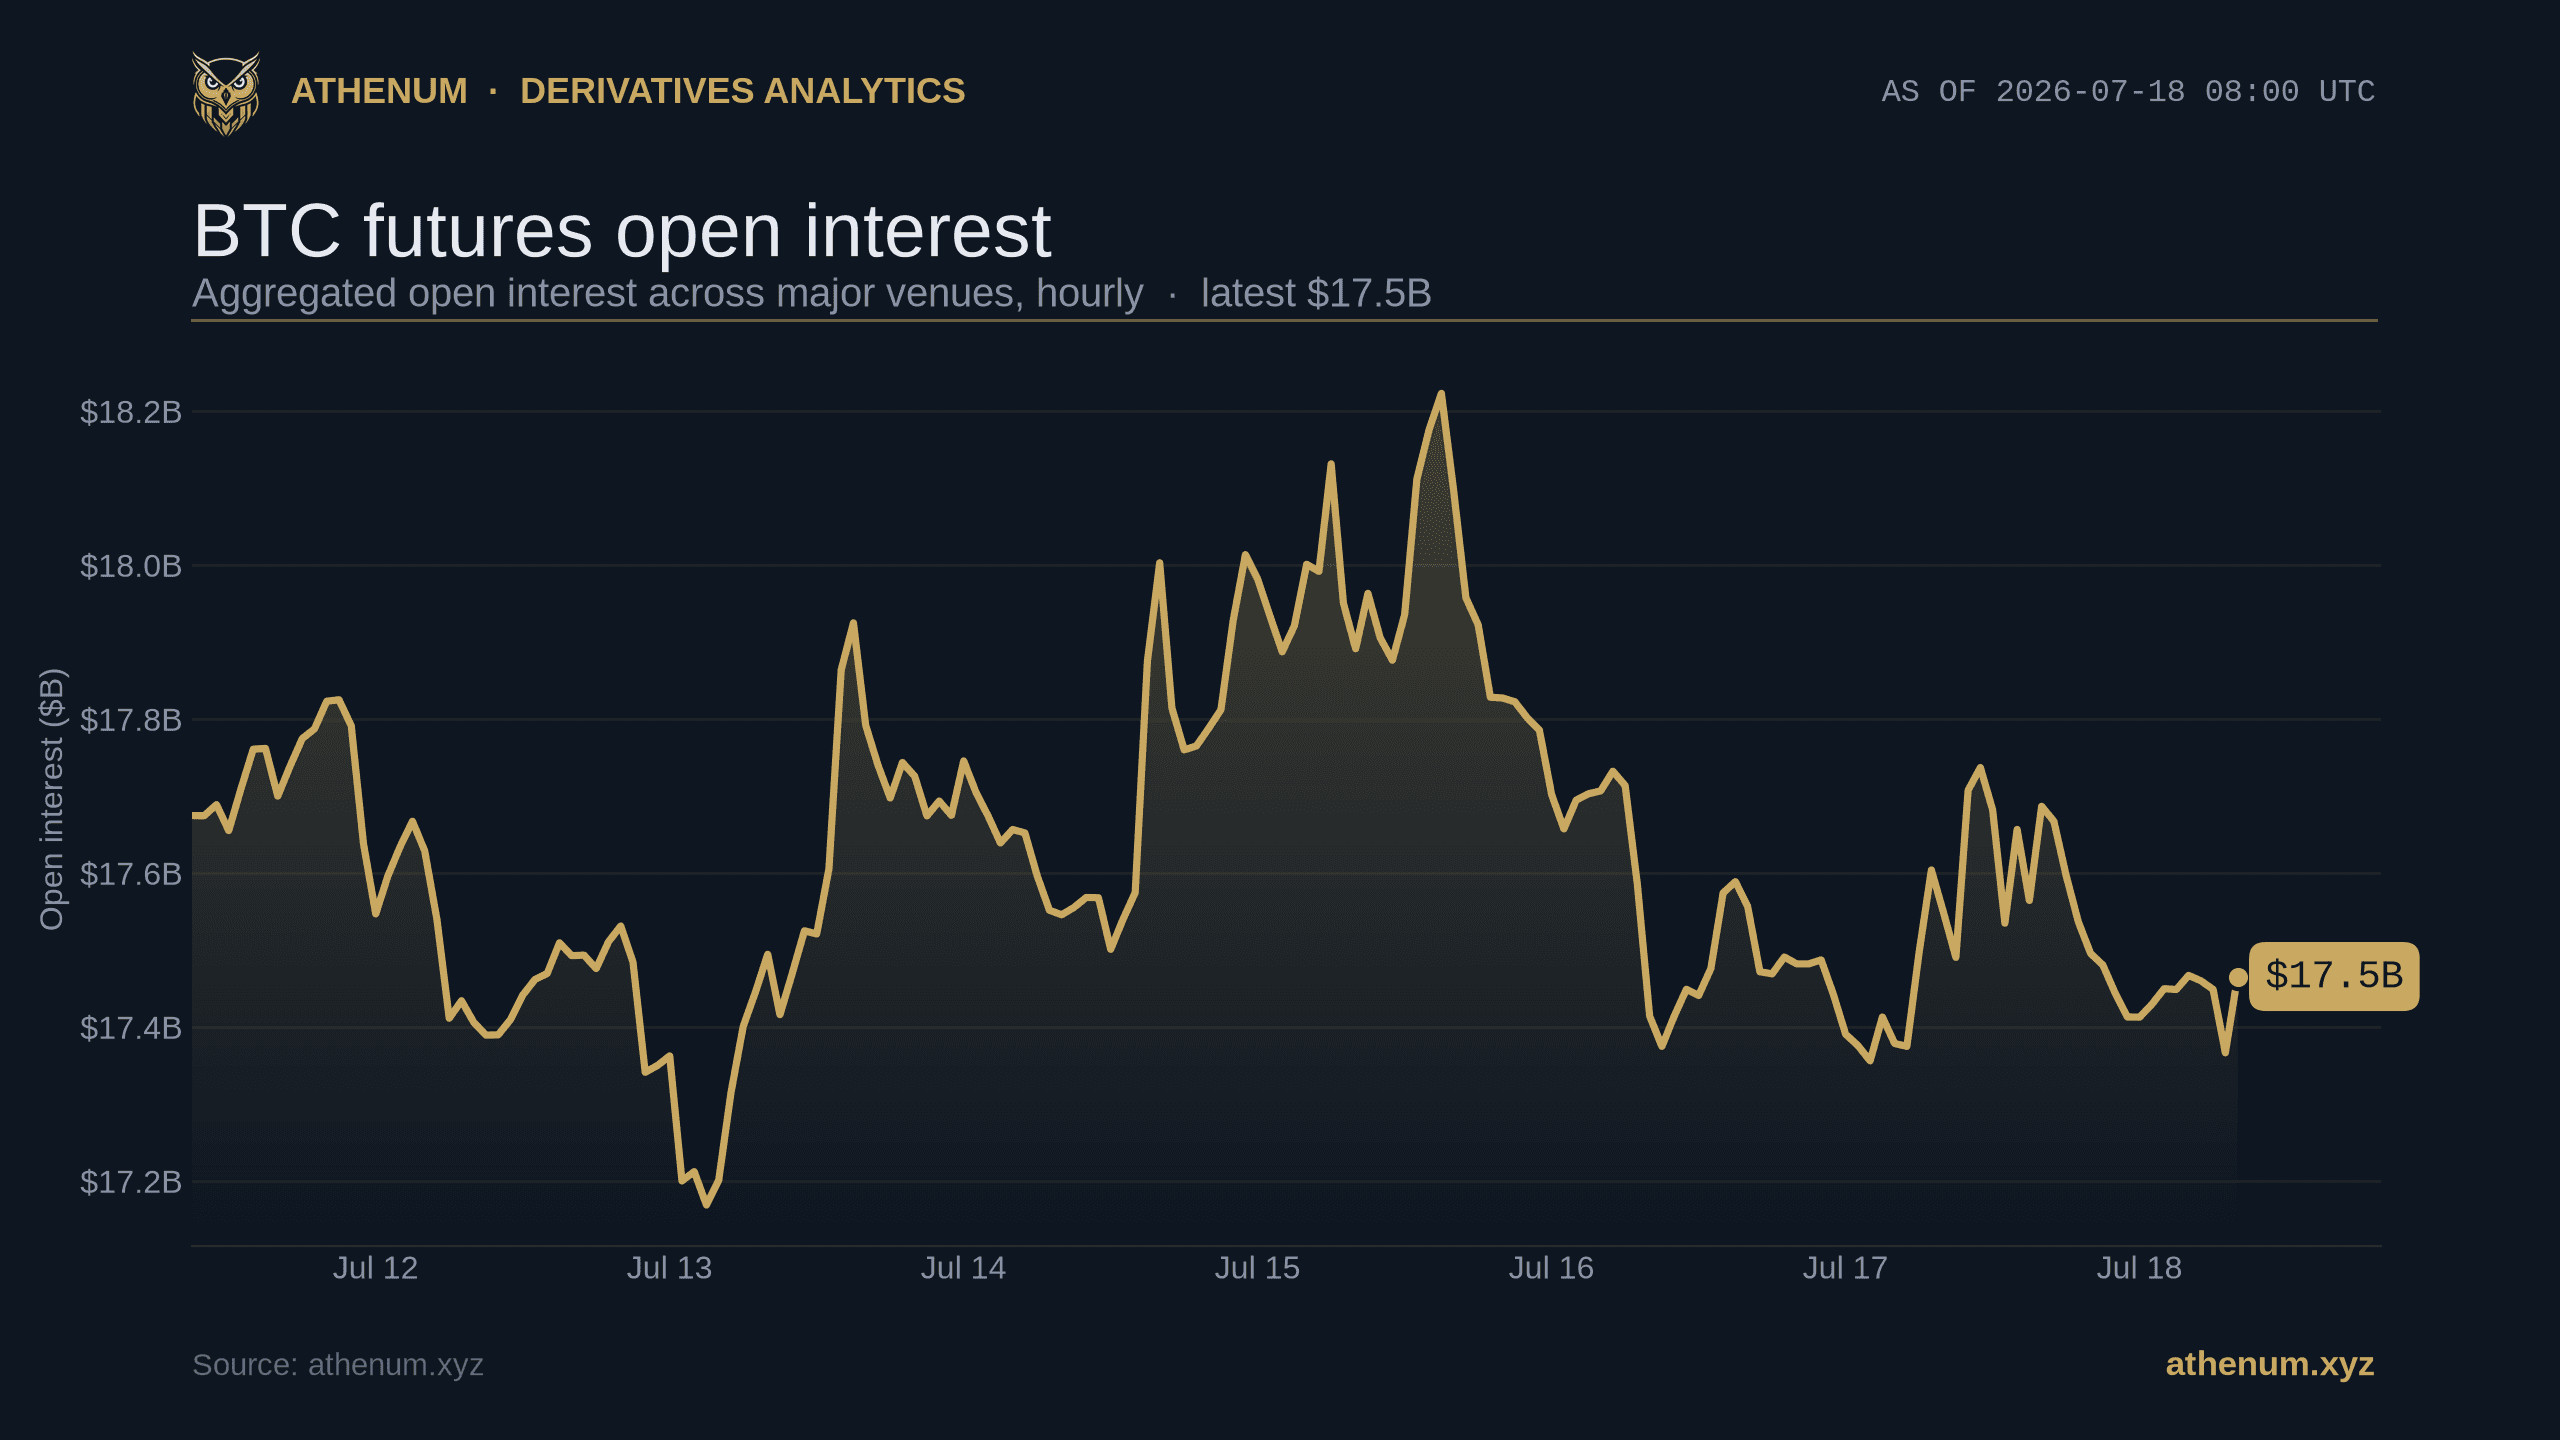
Insurance Fund and Auto-Deleveraging (ADL) in Crypto Futures: What Happens After a Forced Liquidation
When a crypto futures liquidation cannot fill at bankruptcy price, the insurance fund and auto-deleveraging (ADL) decide who eats the loss. Here is how each works, and what today's cross-exchange leverage says about which side ADL would hit.
 Athenum Analytics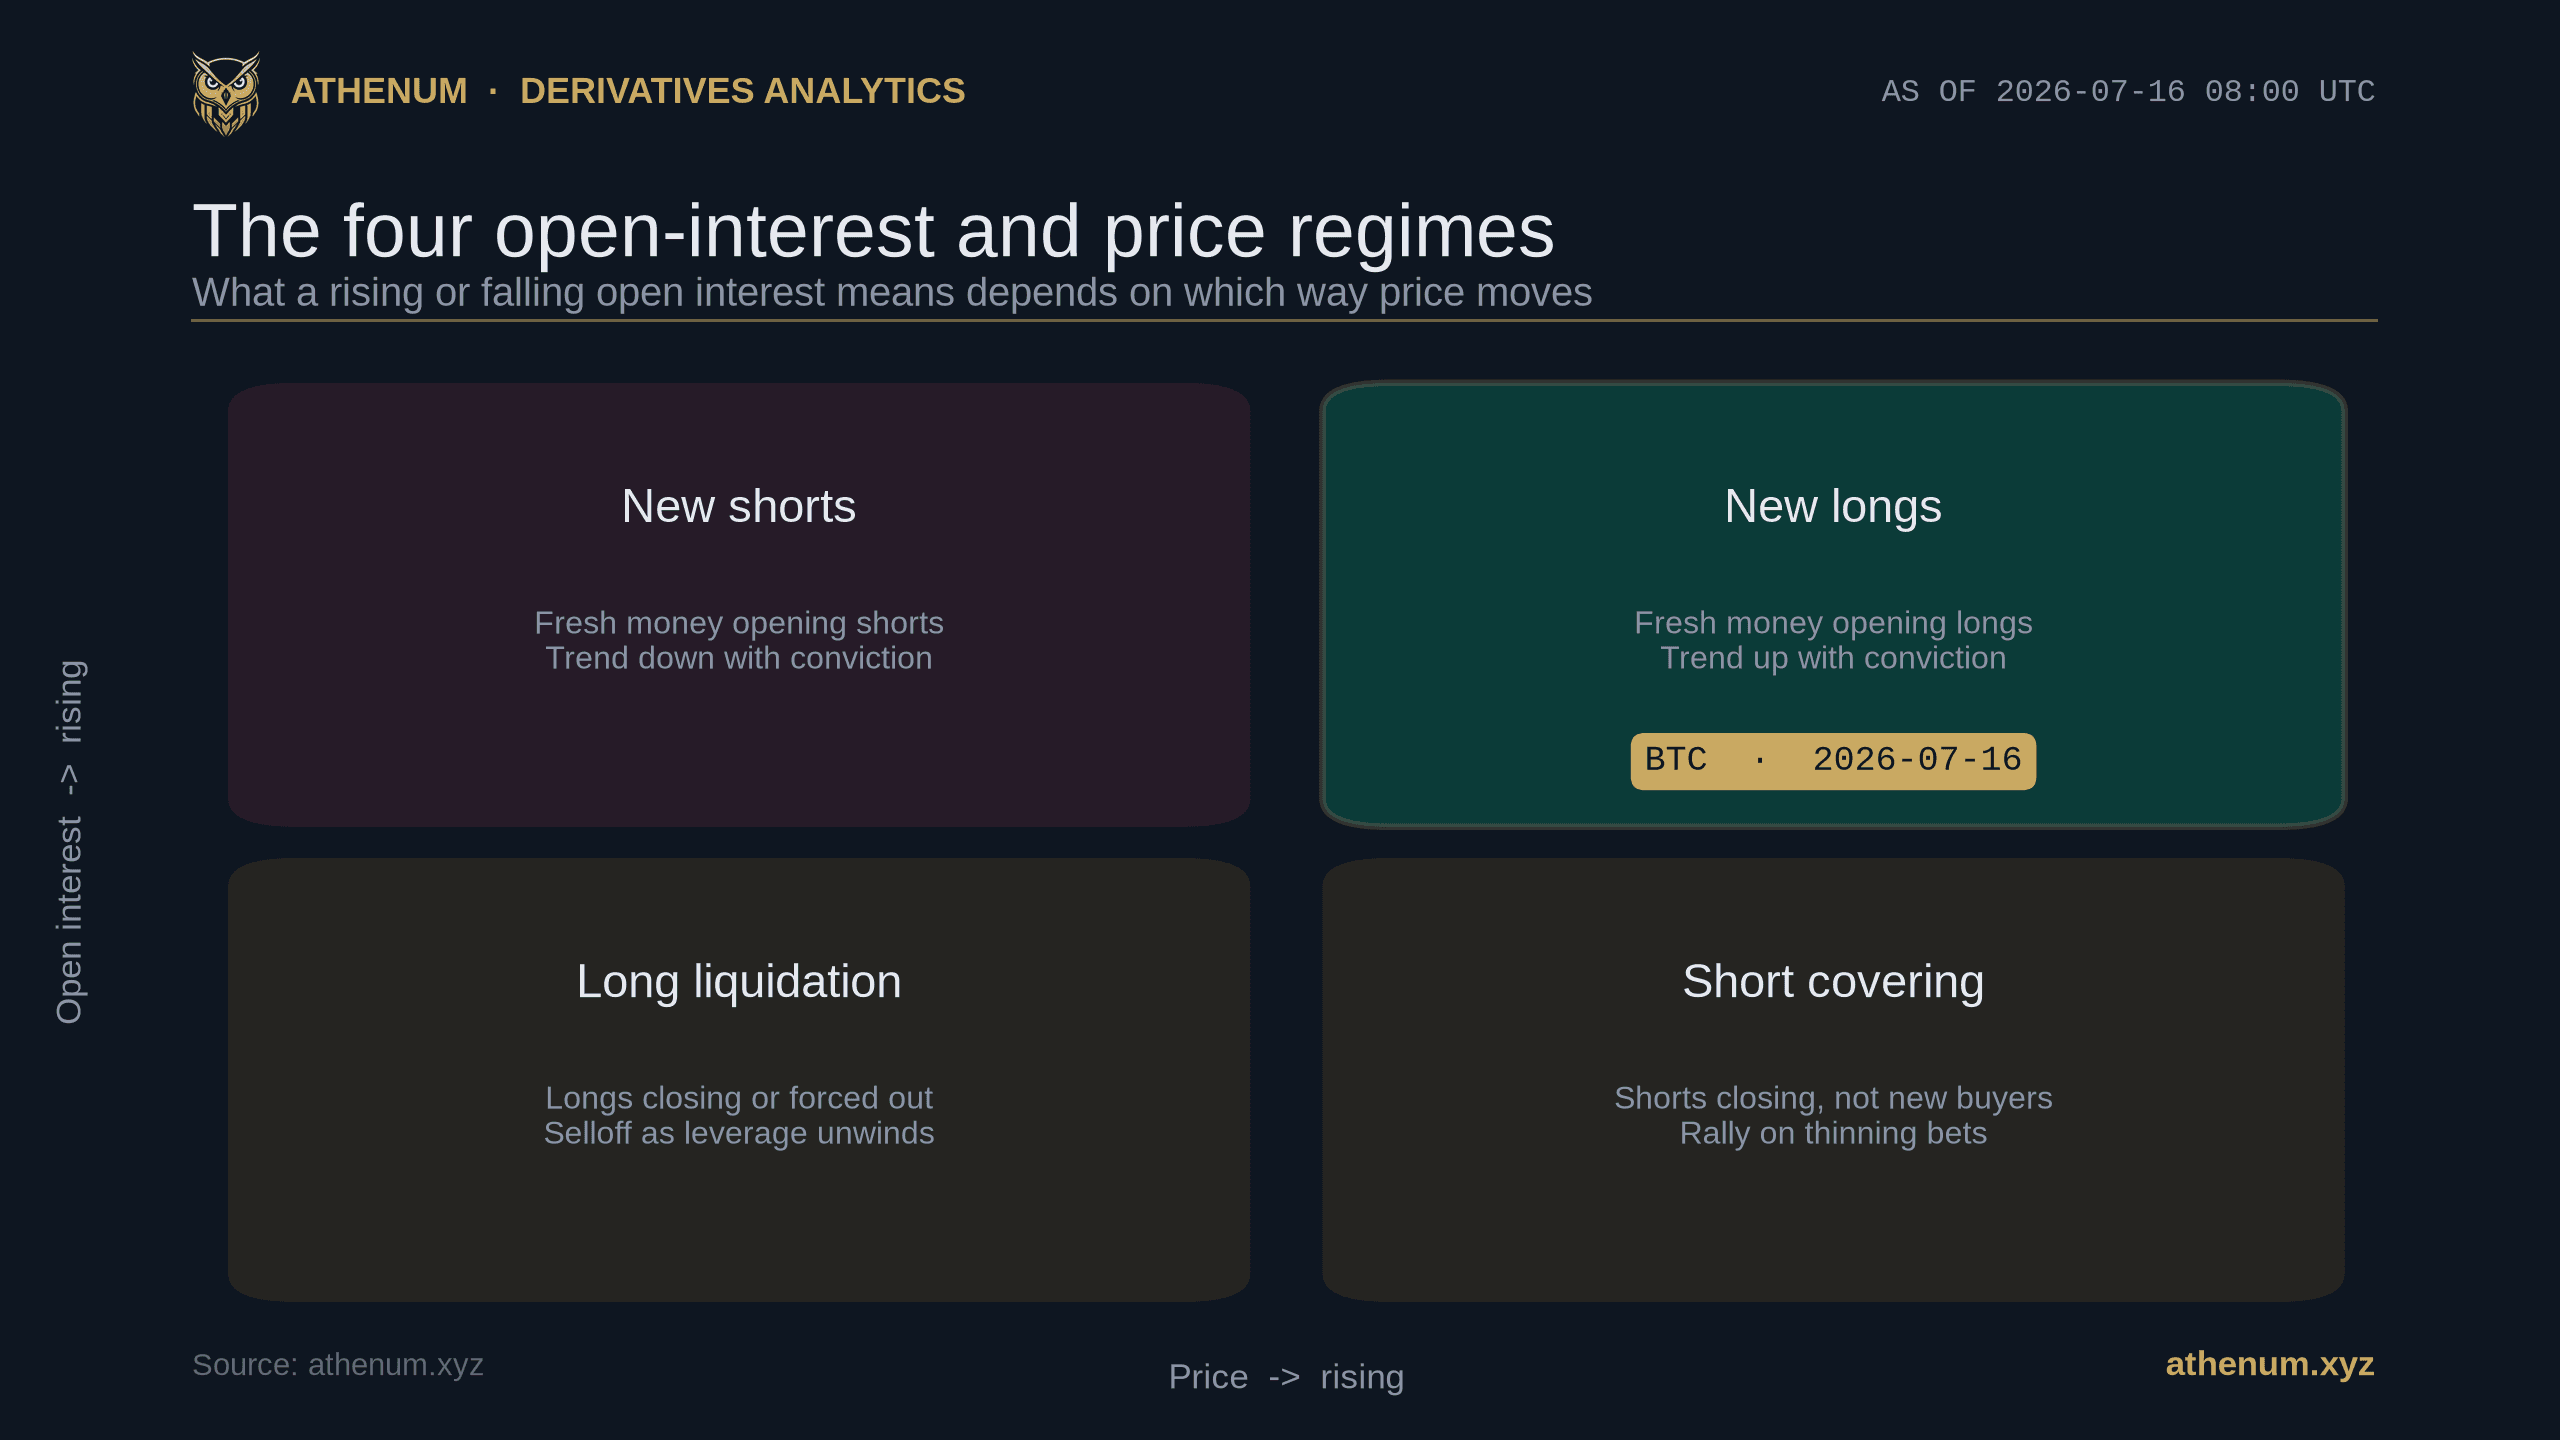
Open Interest and Price: How to Read the Four Regimes of a Crypto Move
Open interest only means something once you read it against price. Learn the four regimes (new longs, new shorts, short covering, long liquidation) and BTC's live 2026-07-16 read across 14 exchanges.
Athenum Analytics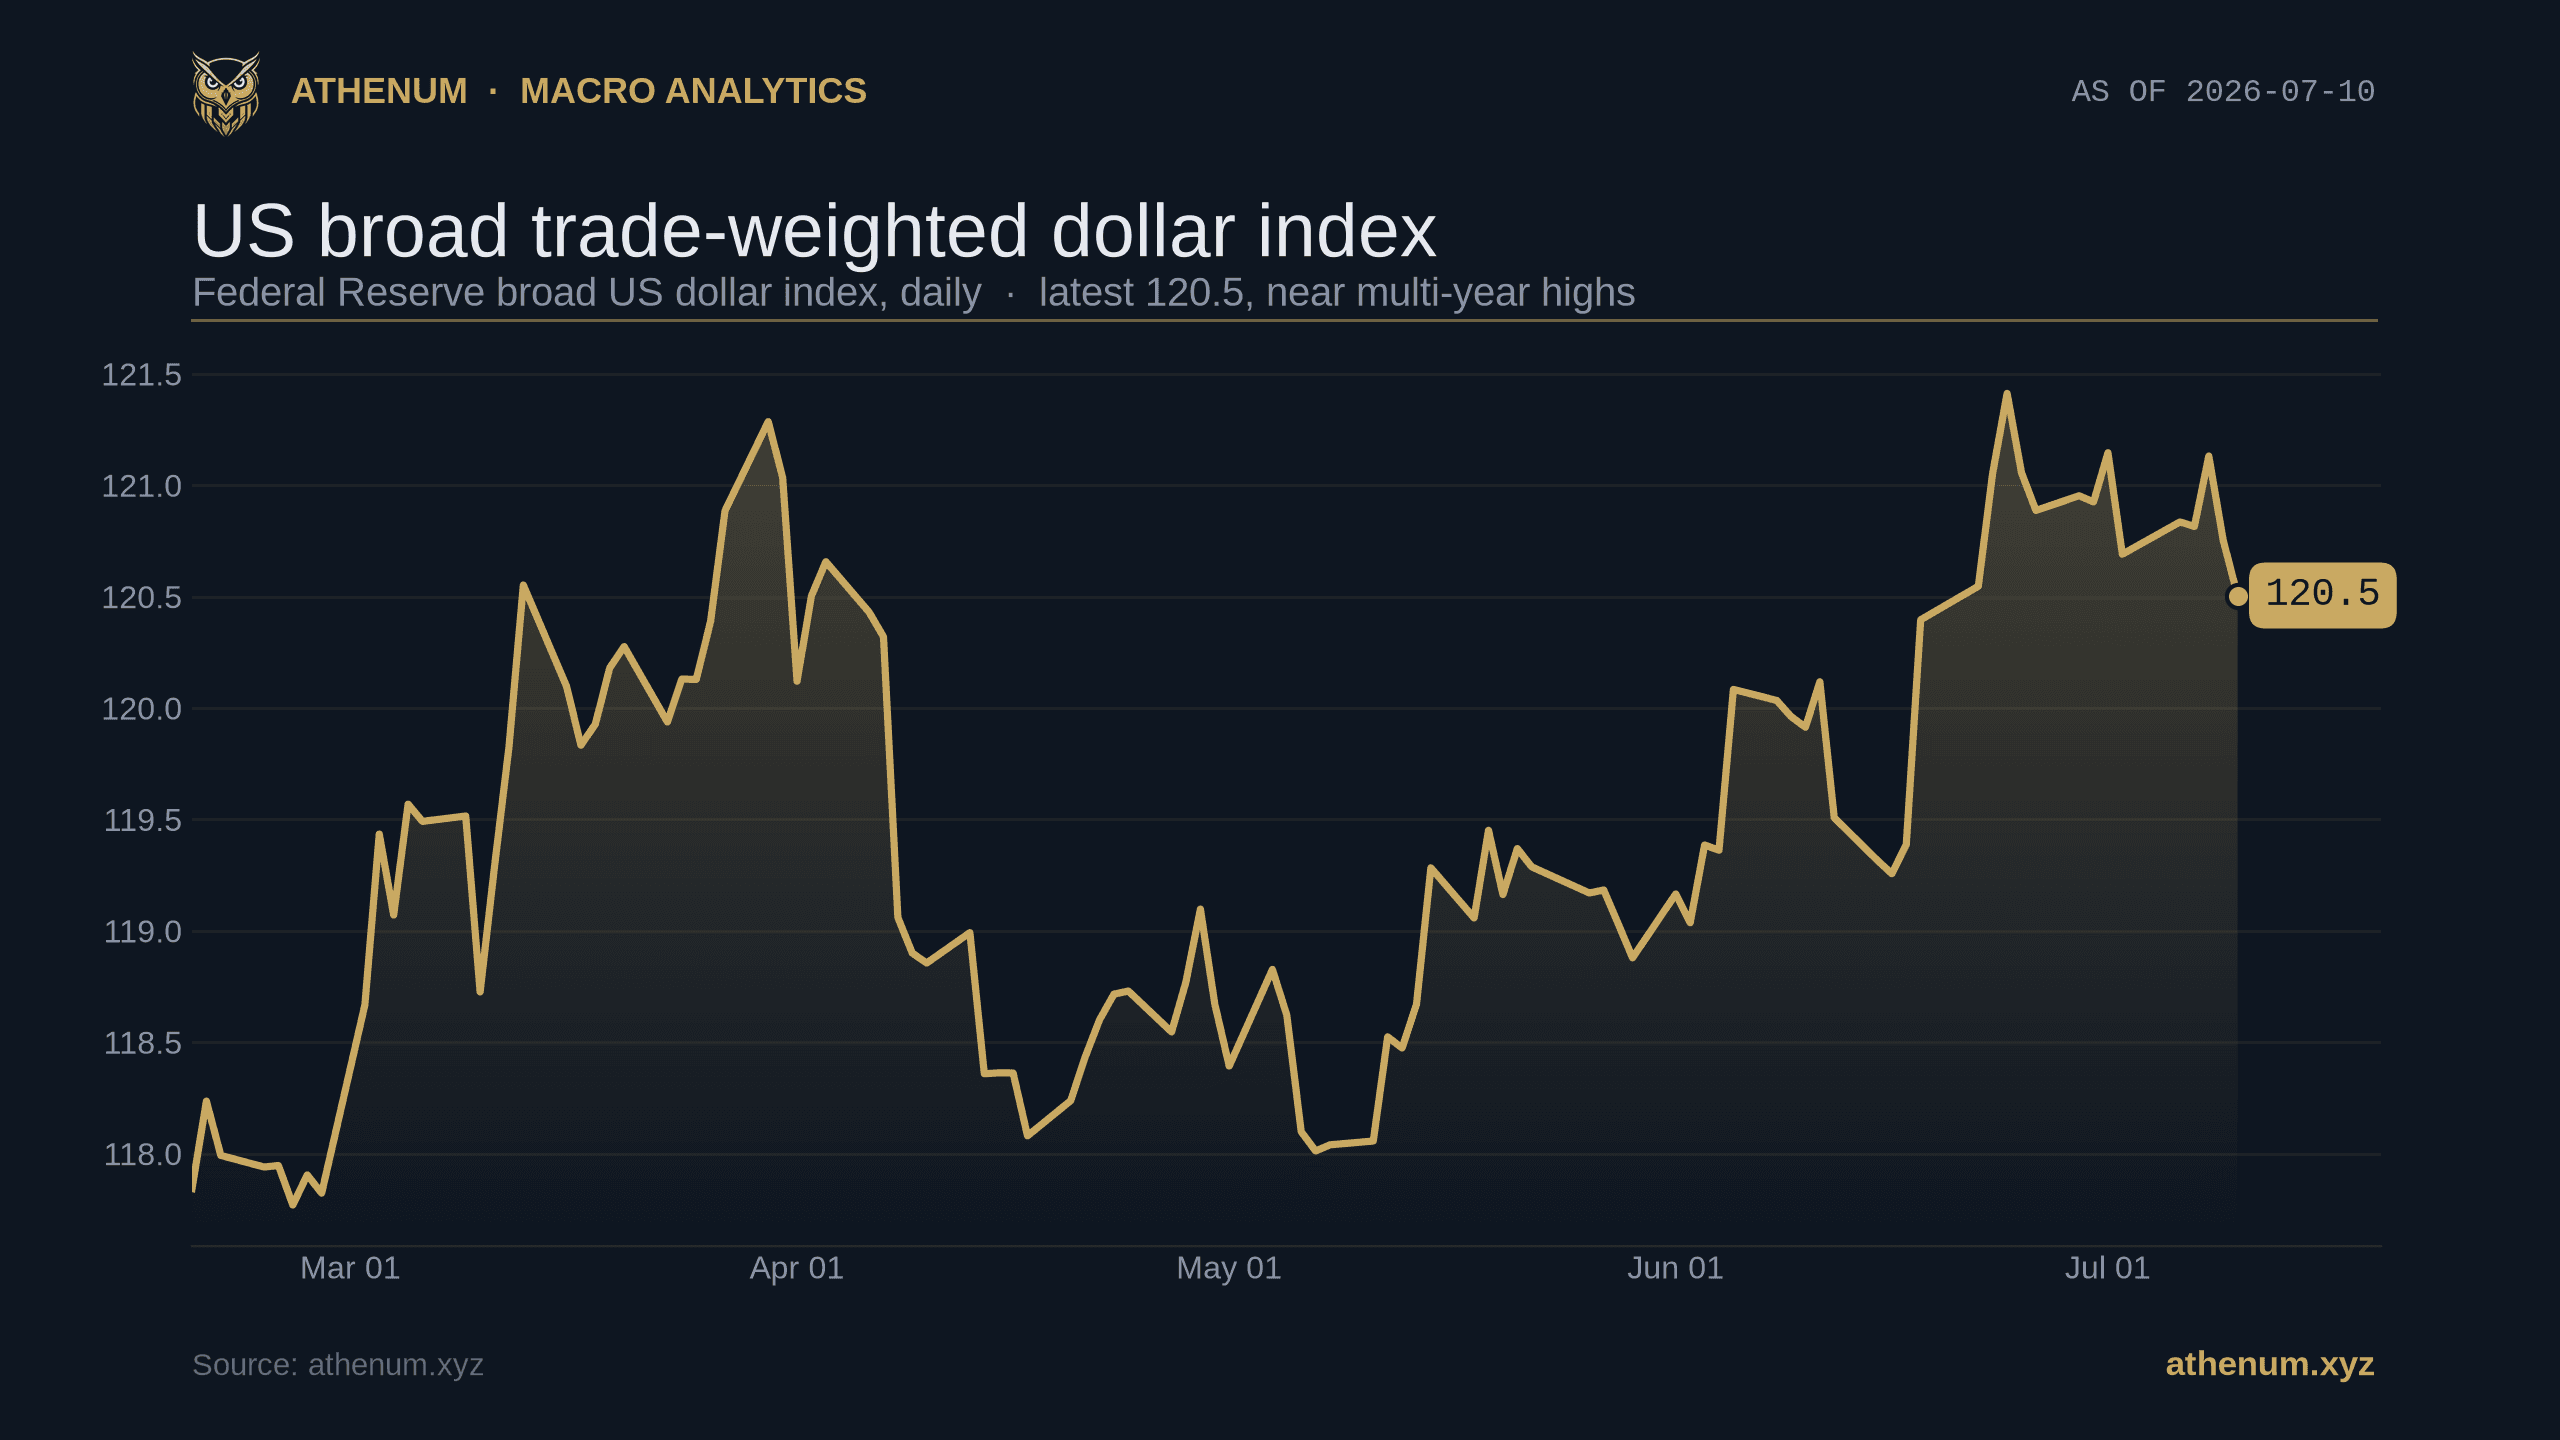
The Dollar Index and Bitcoin: Does a Stronger Dollar Really Pressure Crypto?
The dollar index and Bitcoin: why a strong dollar and rising real yields pressure crypto in 2026, and how the DXY inverse correlation keeps flipping.
Athenum Analytics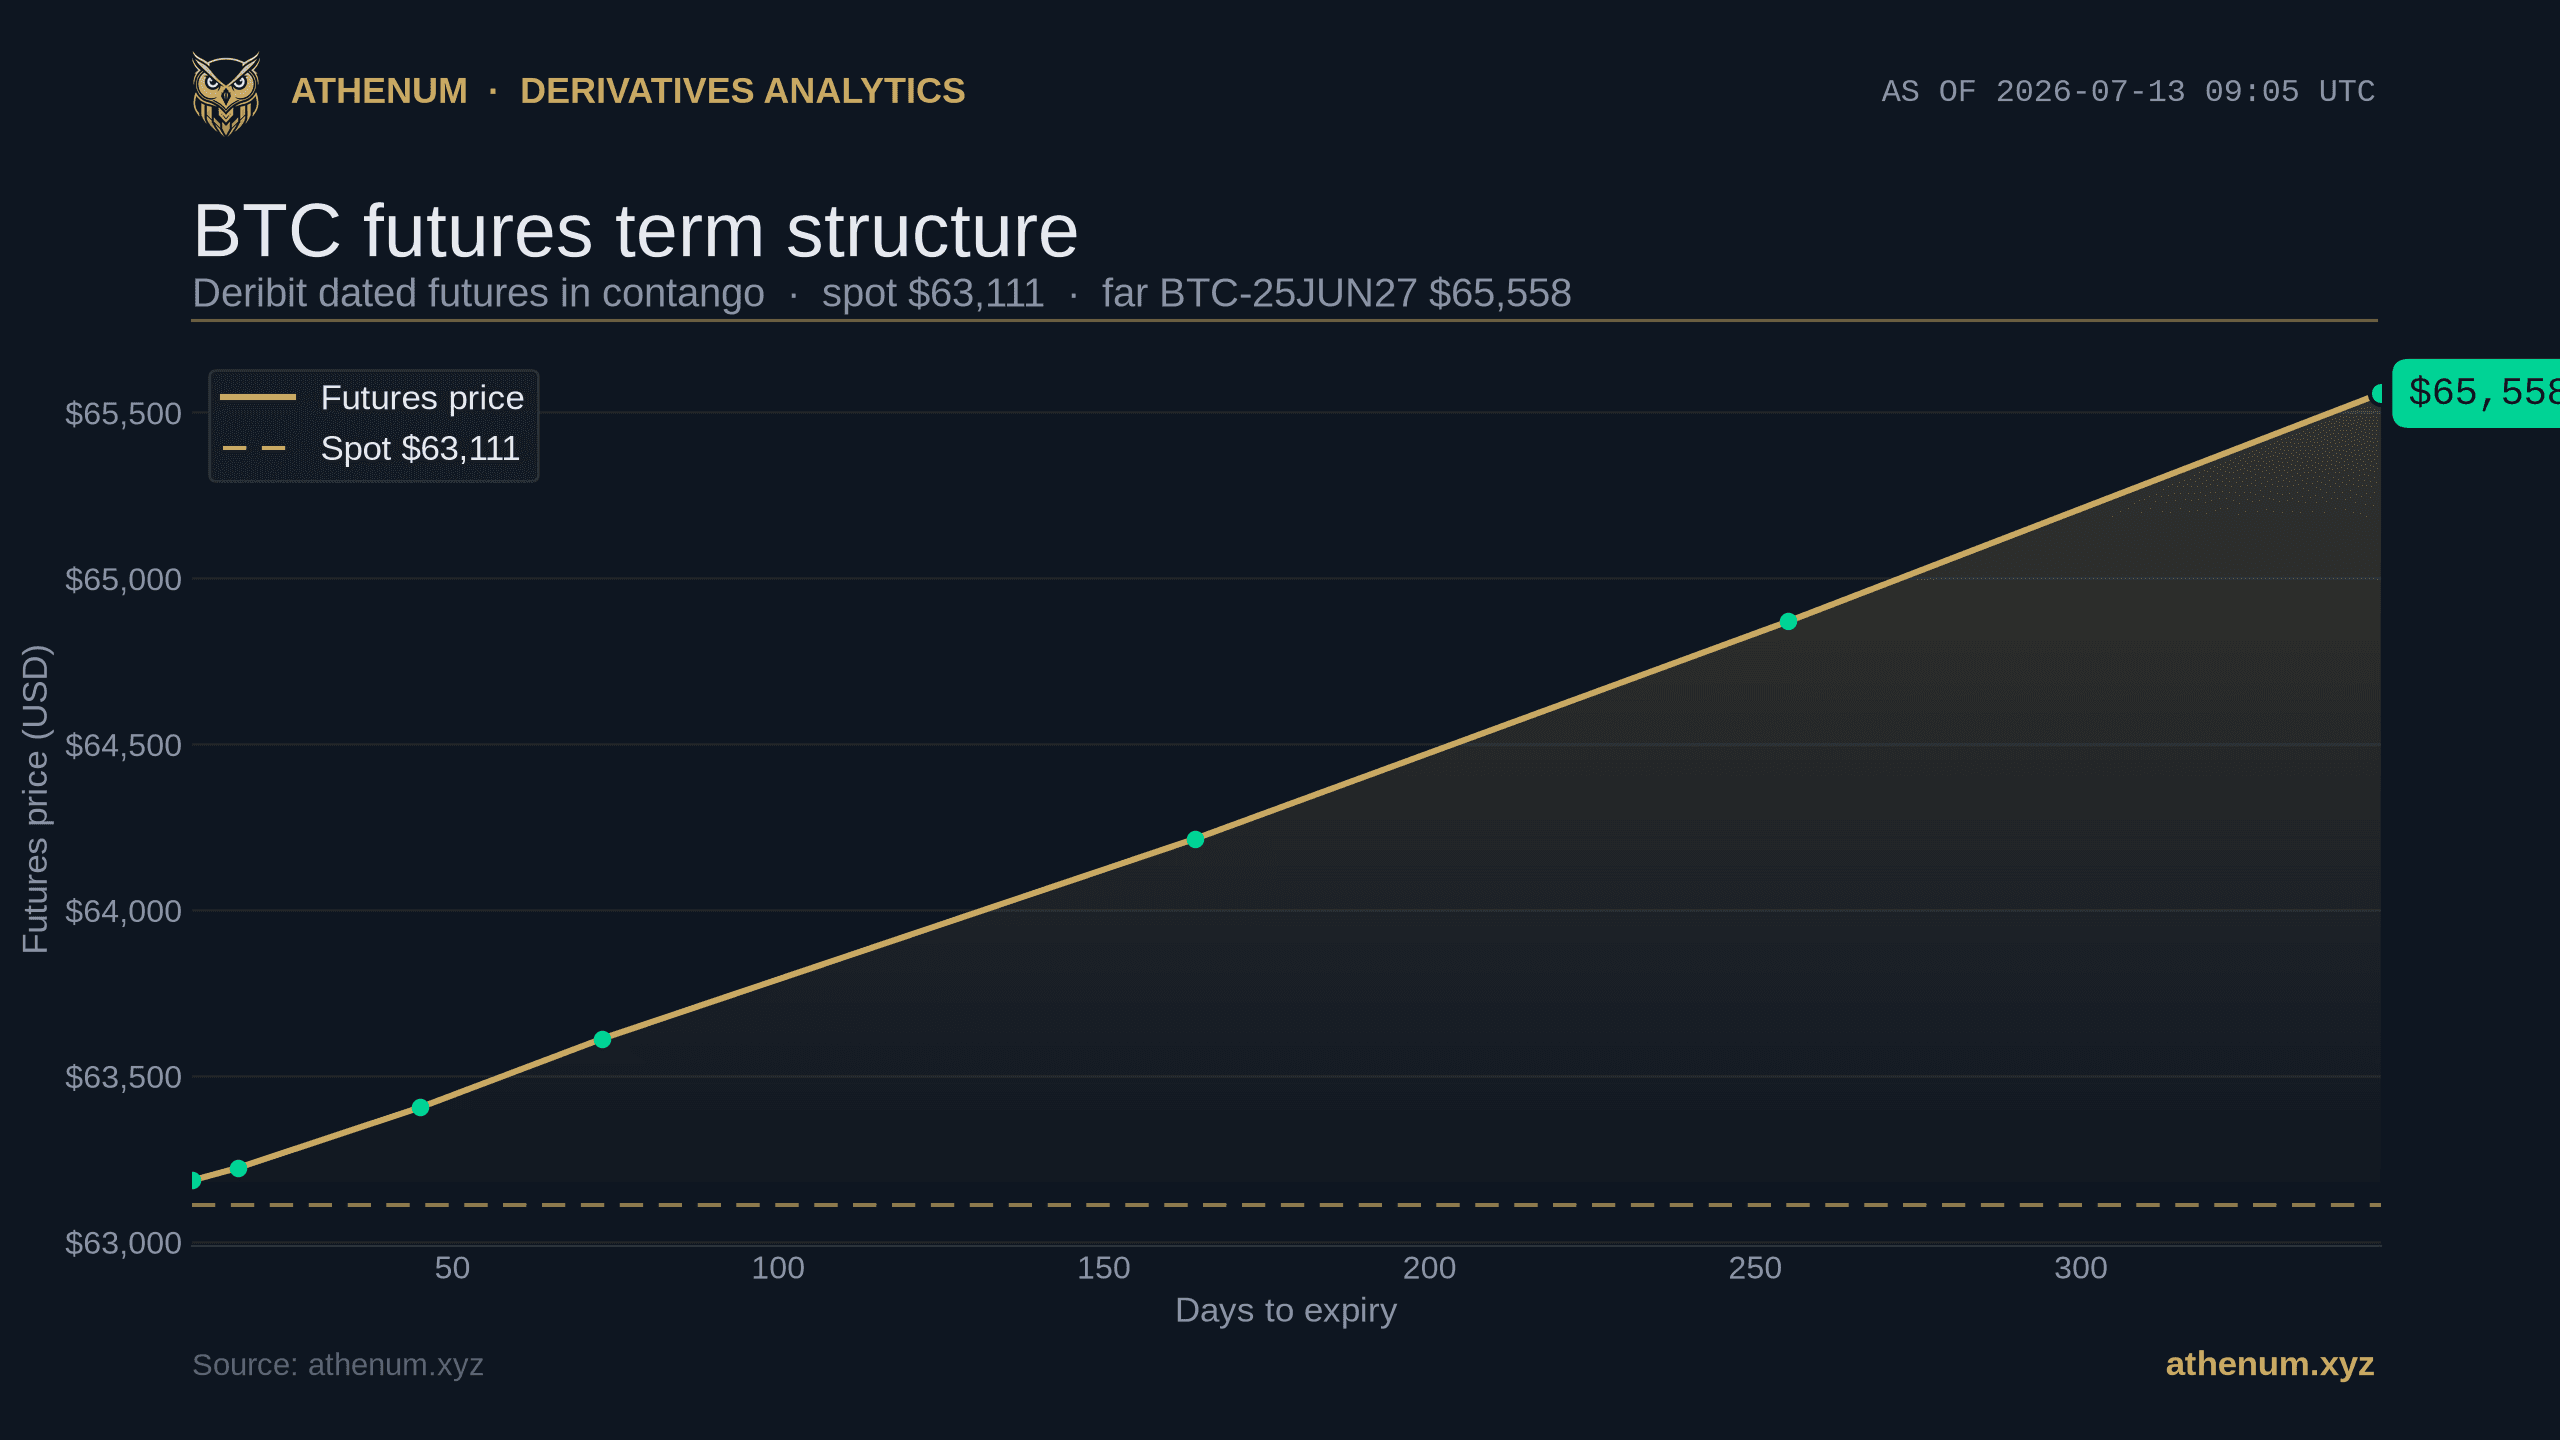
The Crypto Futures Basis Term Structure: How to Read Contango, Backwardation, and Carry
The crypto futures basis term structure shows contango or backwardation. Read BTC annualized basis by tenor, the front-week noise, and the cross-venue spread.
Athenum Analytics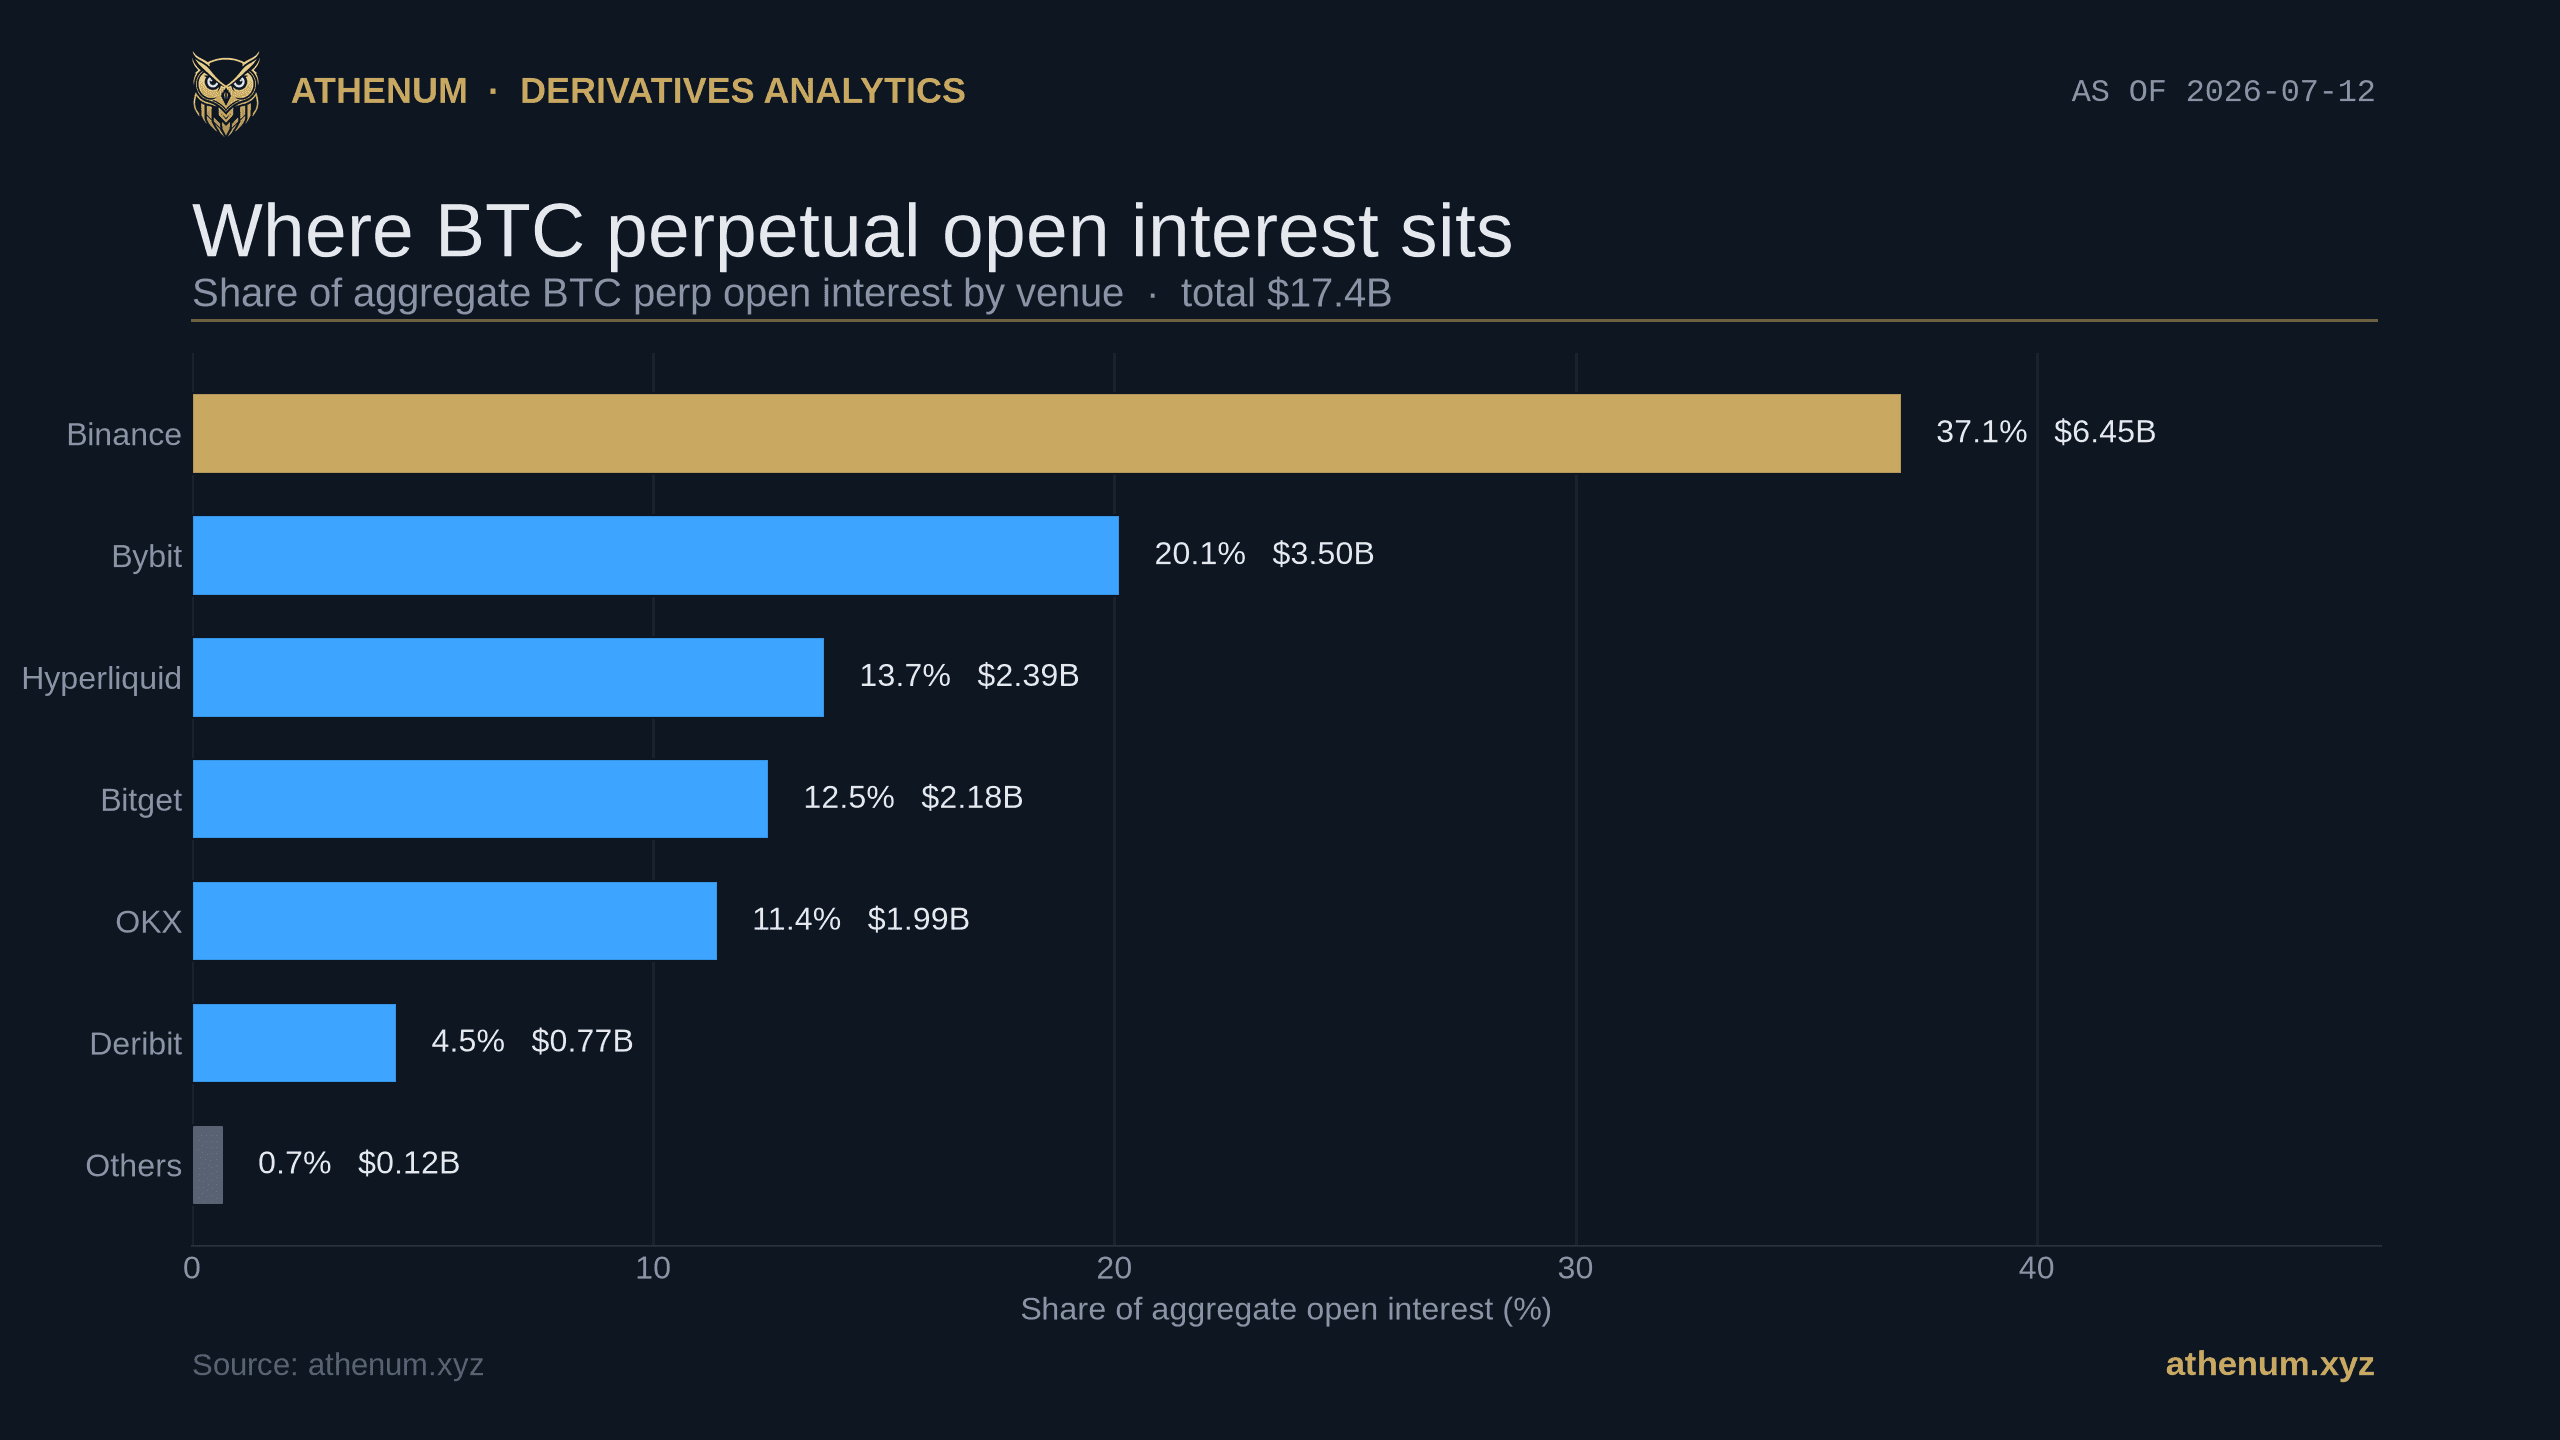
Open Interest by Exchange: Where Crypto's Leverage Actually Sits
Open interest by exchange, read as a distribution: as of 2026-07-12 Binance holds 37.1% of BTC perpetual open interest and the top three venues 70.9% of a $17.4B pool.
Athenum Analytics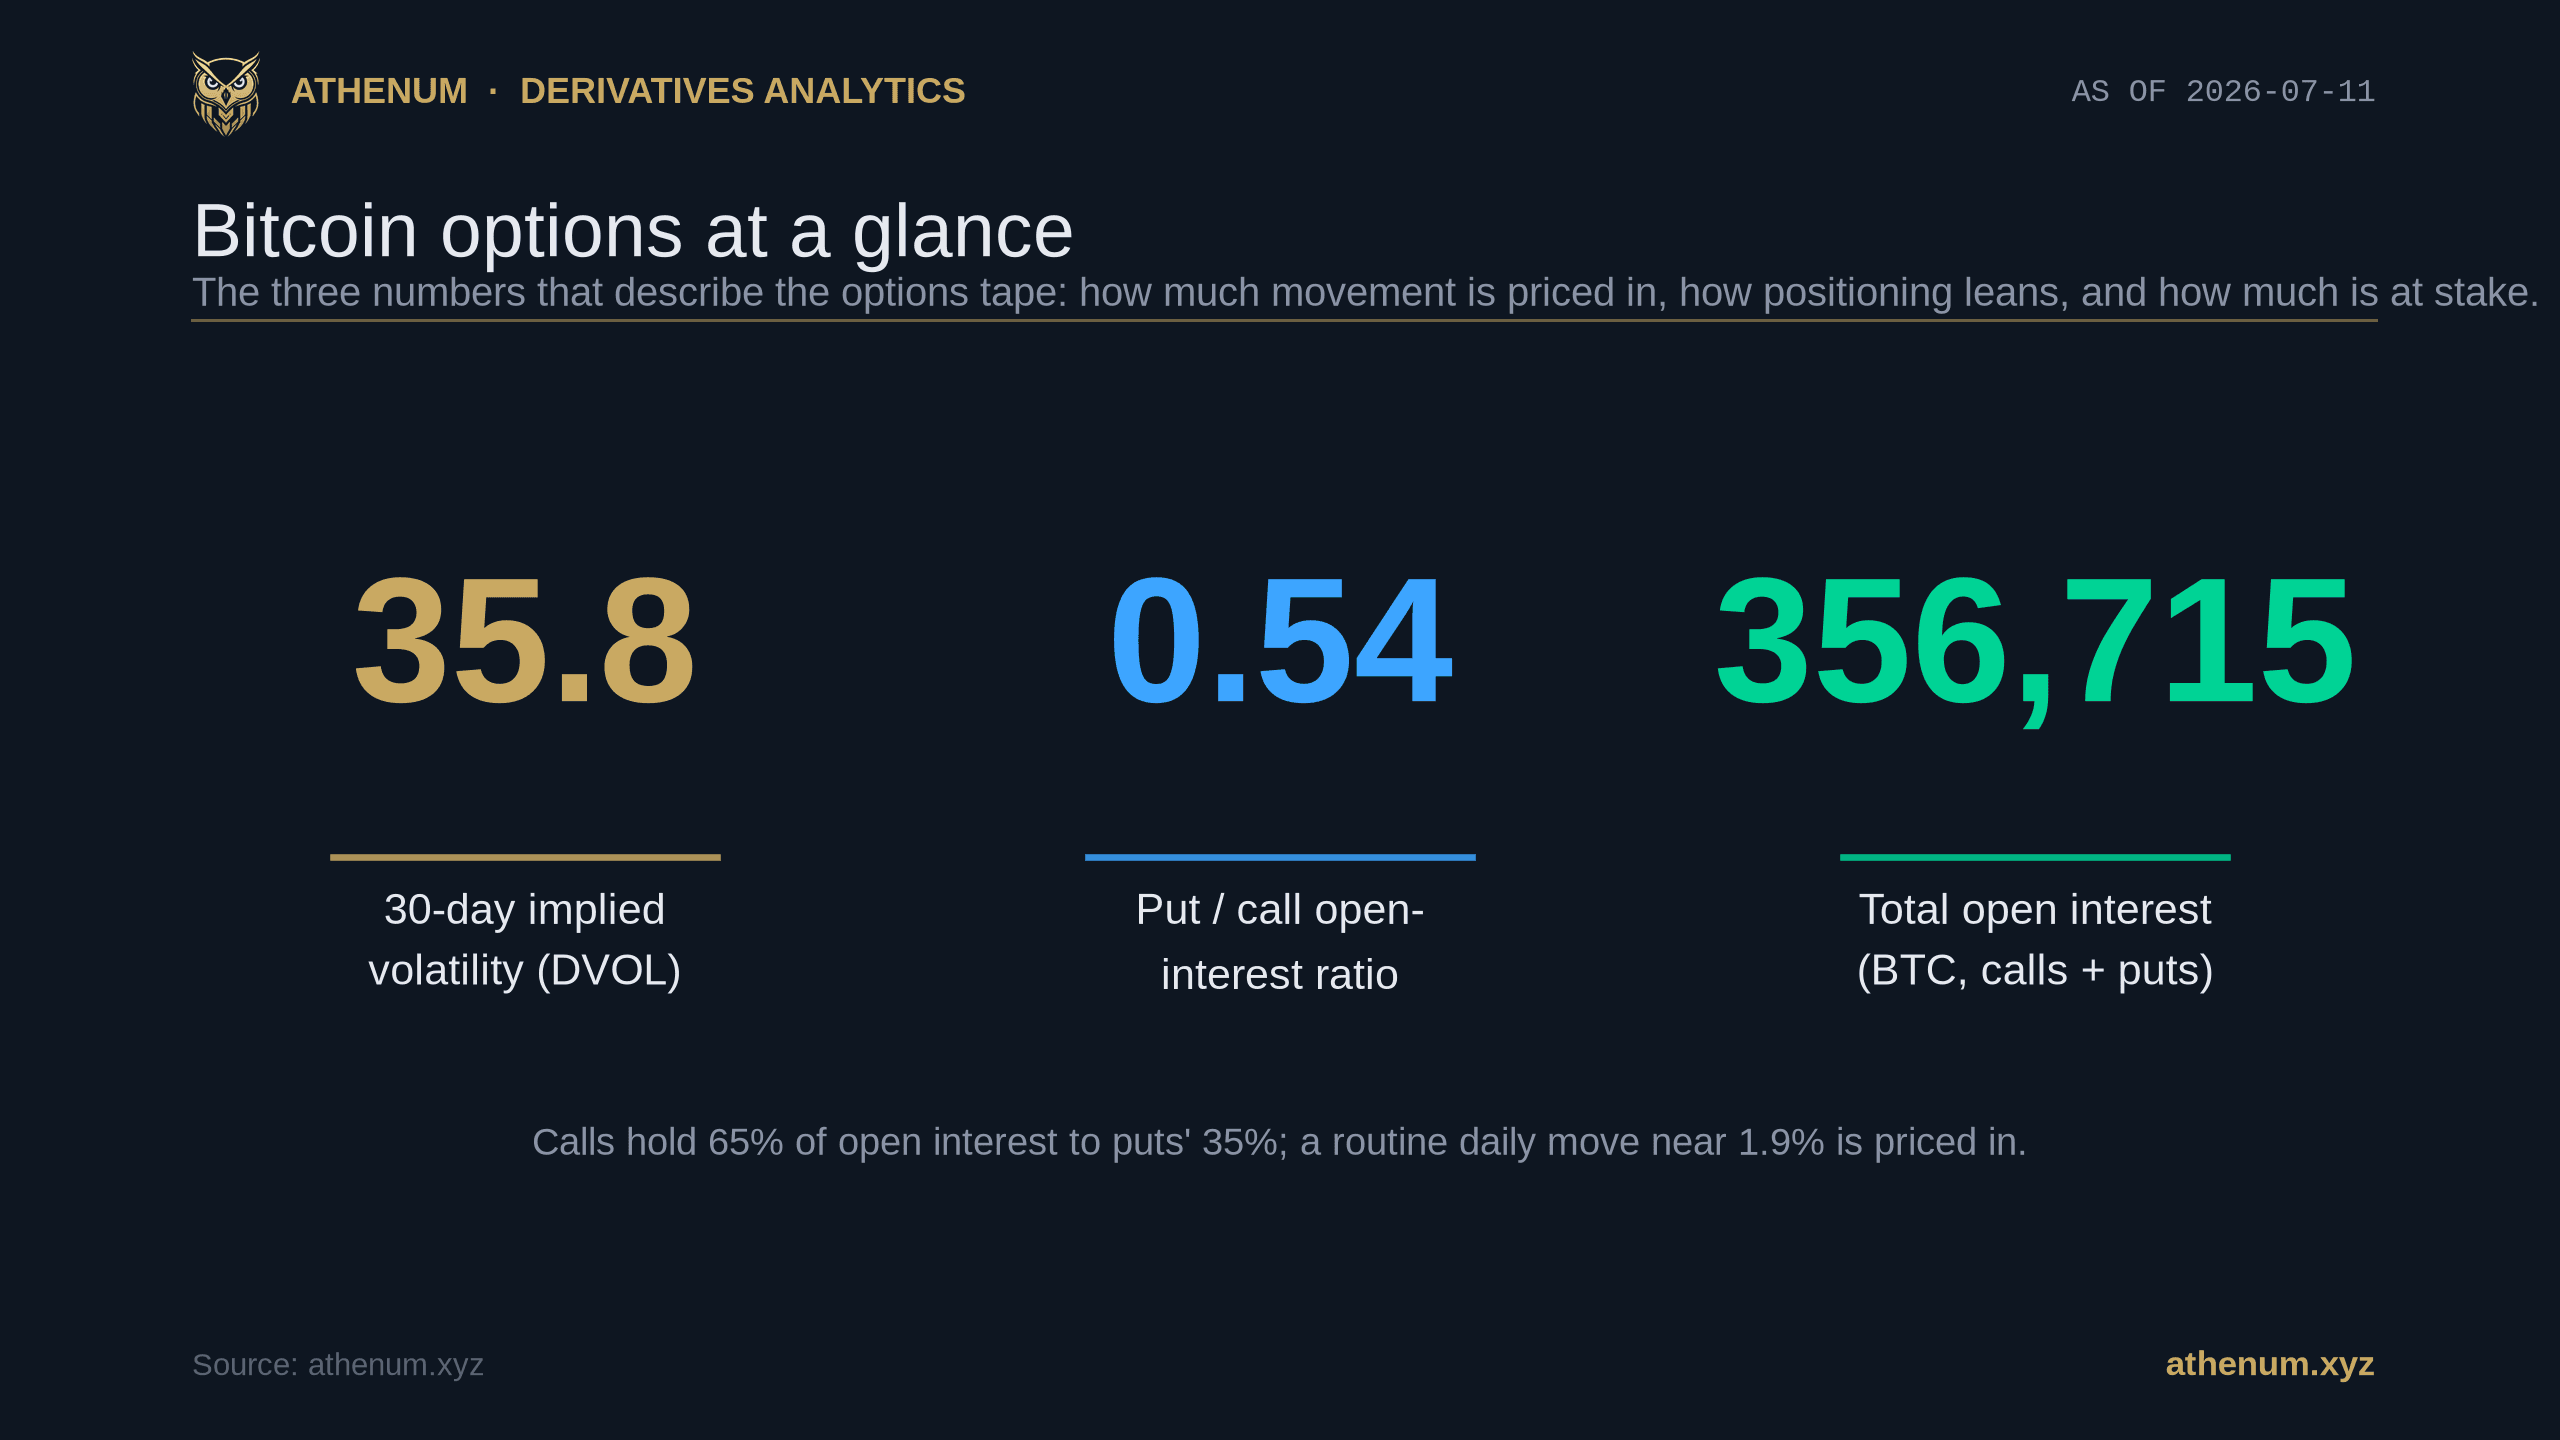
How to Read the Crypto Options Market: Implied Volatility, Put/Call Ratio, and Open Interest
Read the crypto options market with three live numbers: implied volatility (DVOL), the put/call ratio, and open interest, plus a worked Bitcoin example.
Athenum Analytics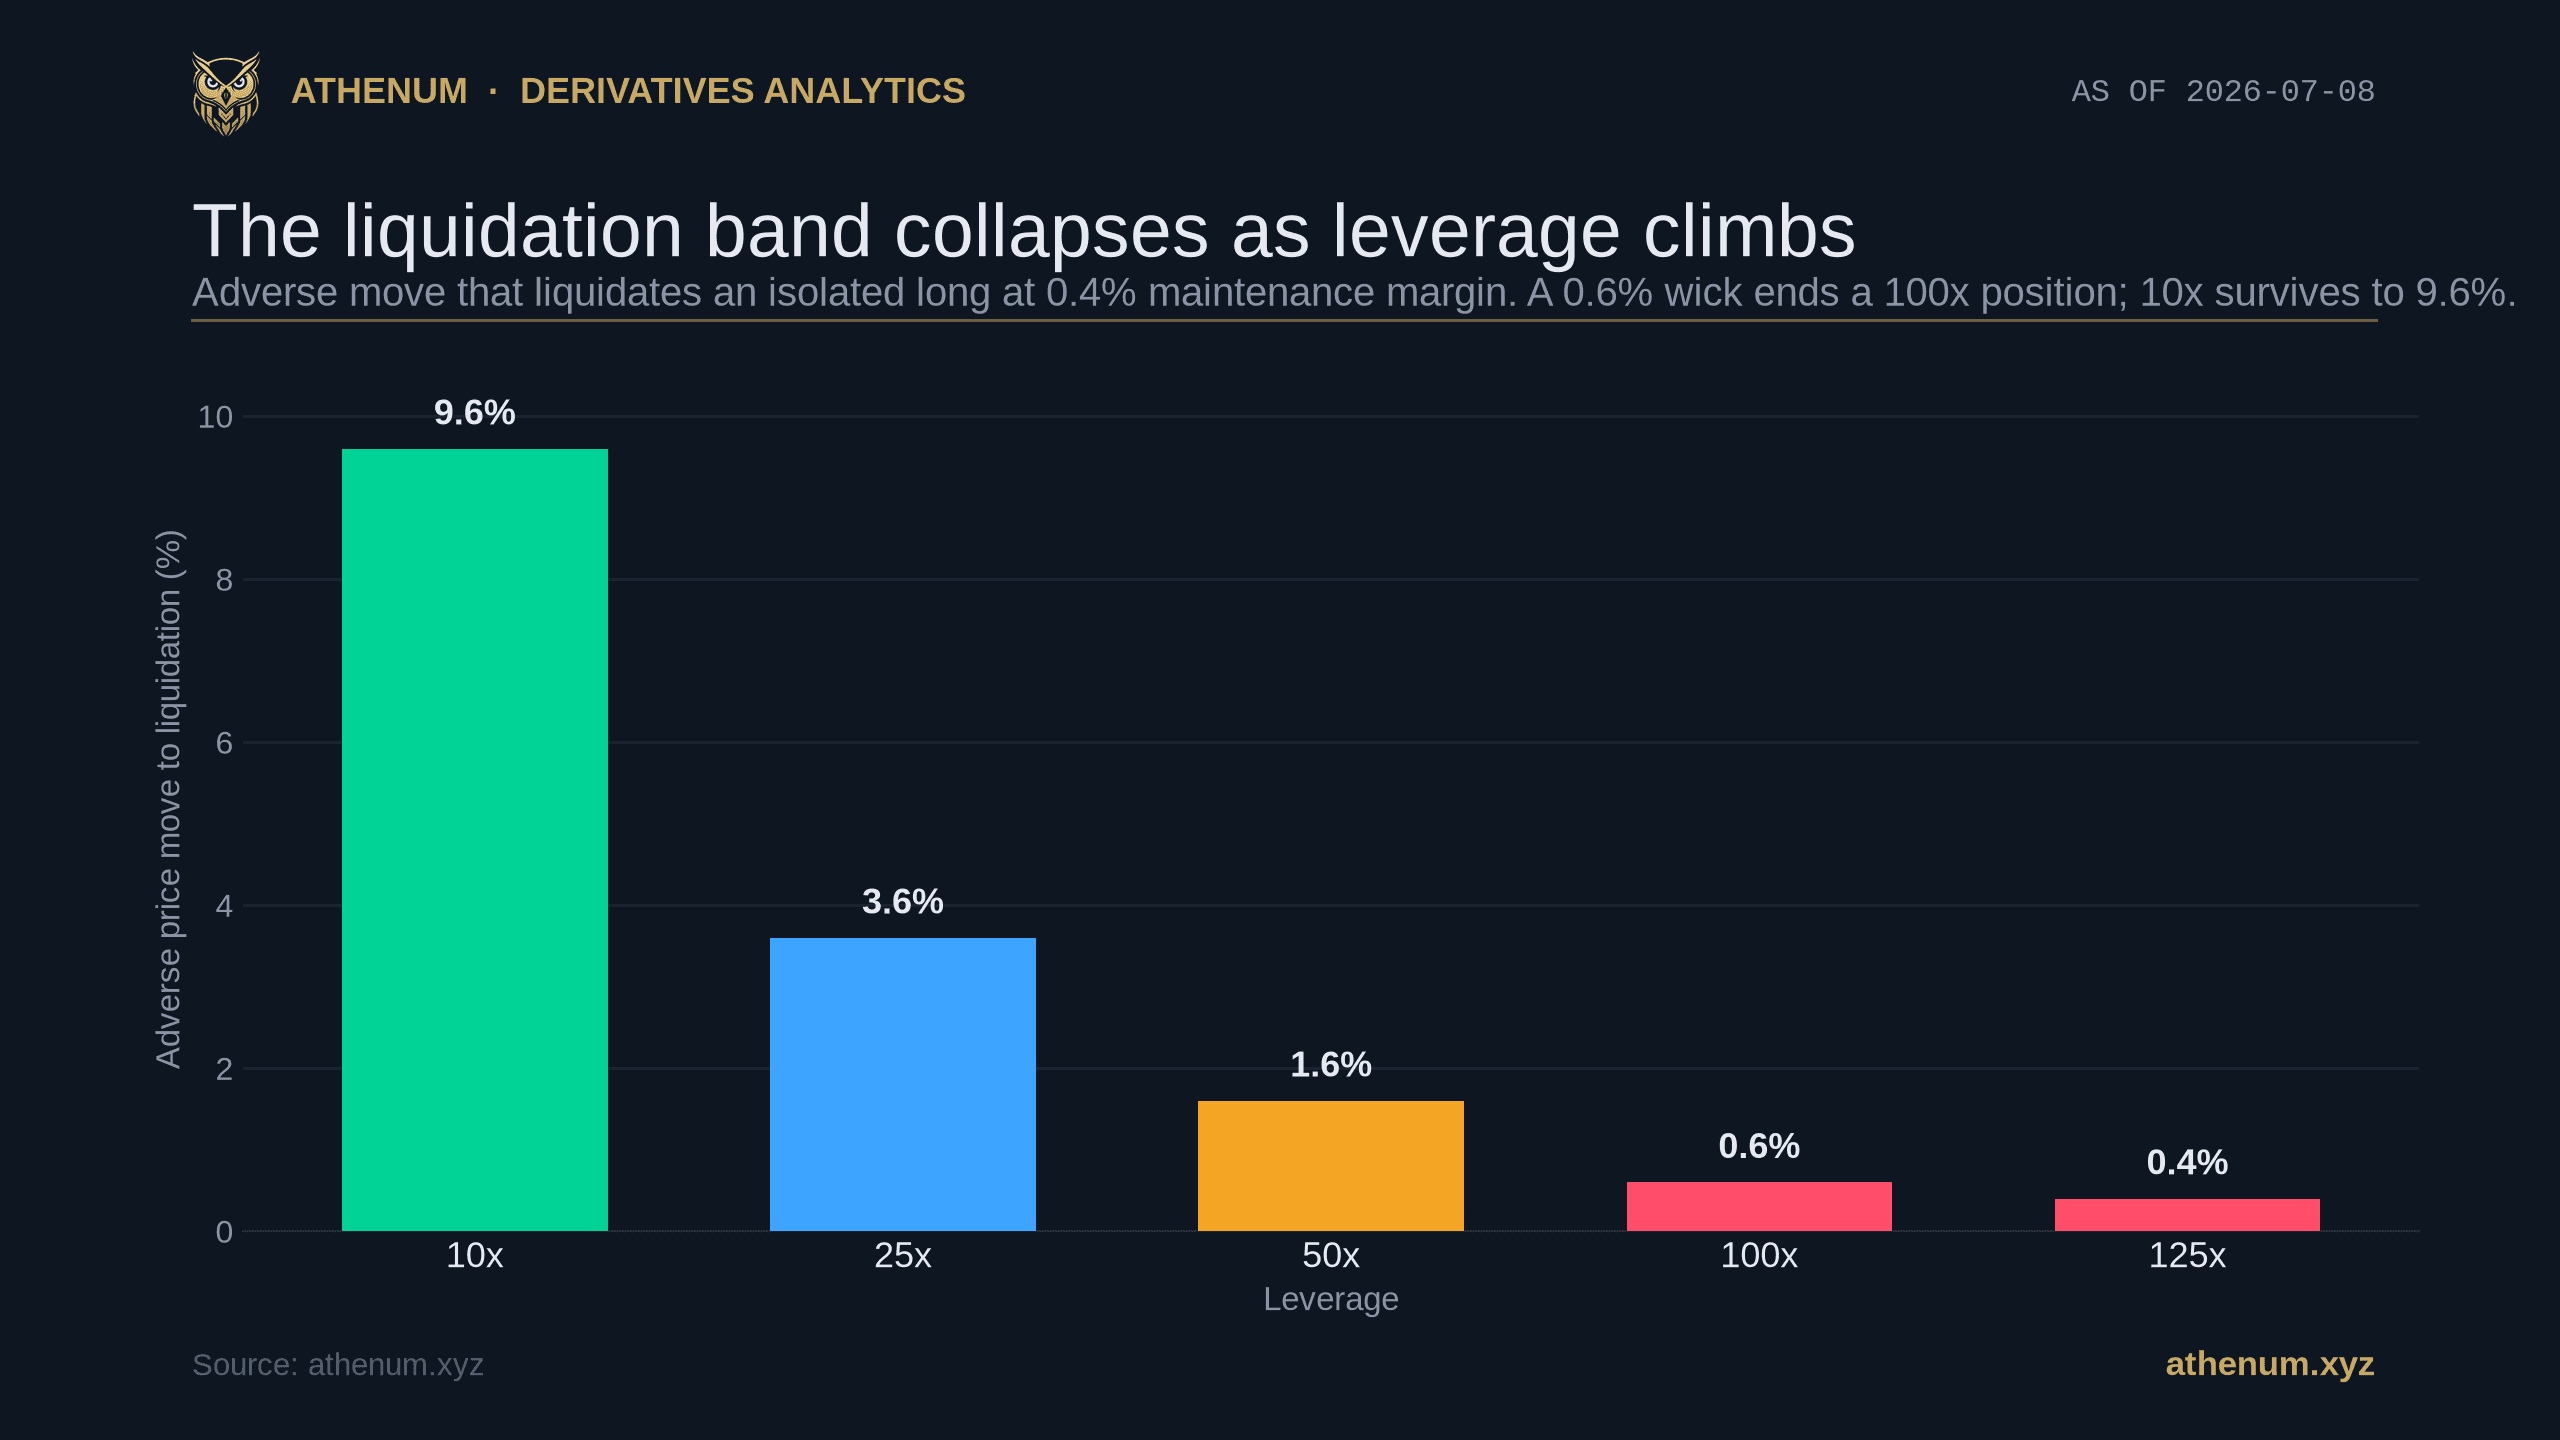
10x vs 100x Leverage in Crypto: Which Should You Actually Use?
10x vs 100x leverage in crypto compared: how liquidation distance, fees, and funding change, with a worked BTC example in the free Athenum calculator.
Athenum Analytics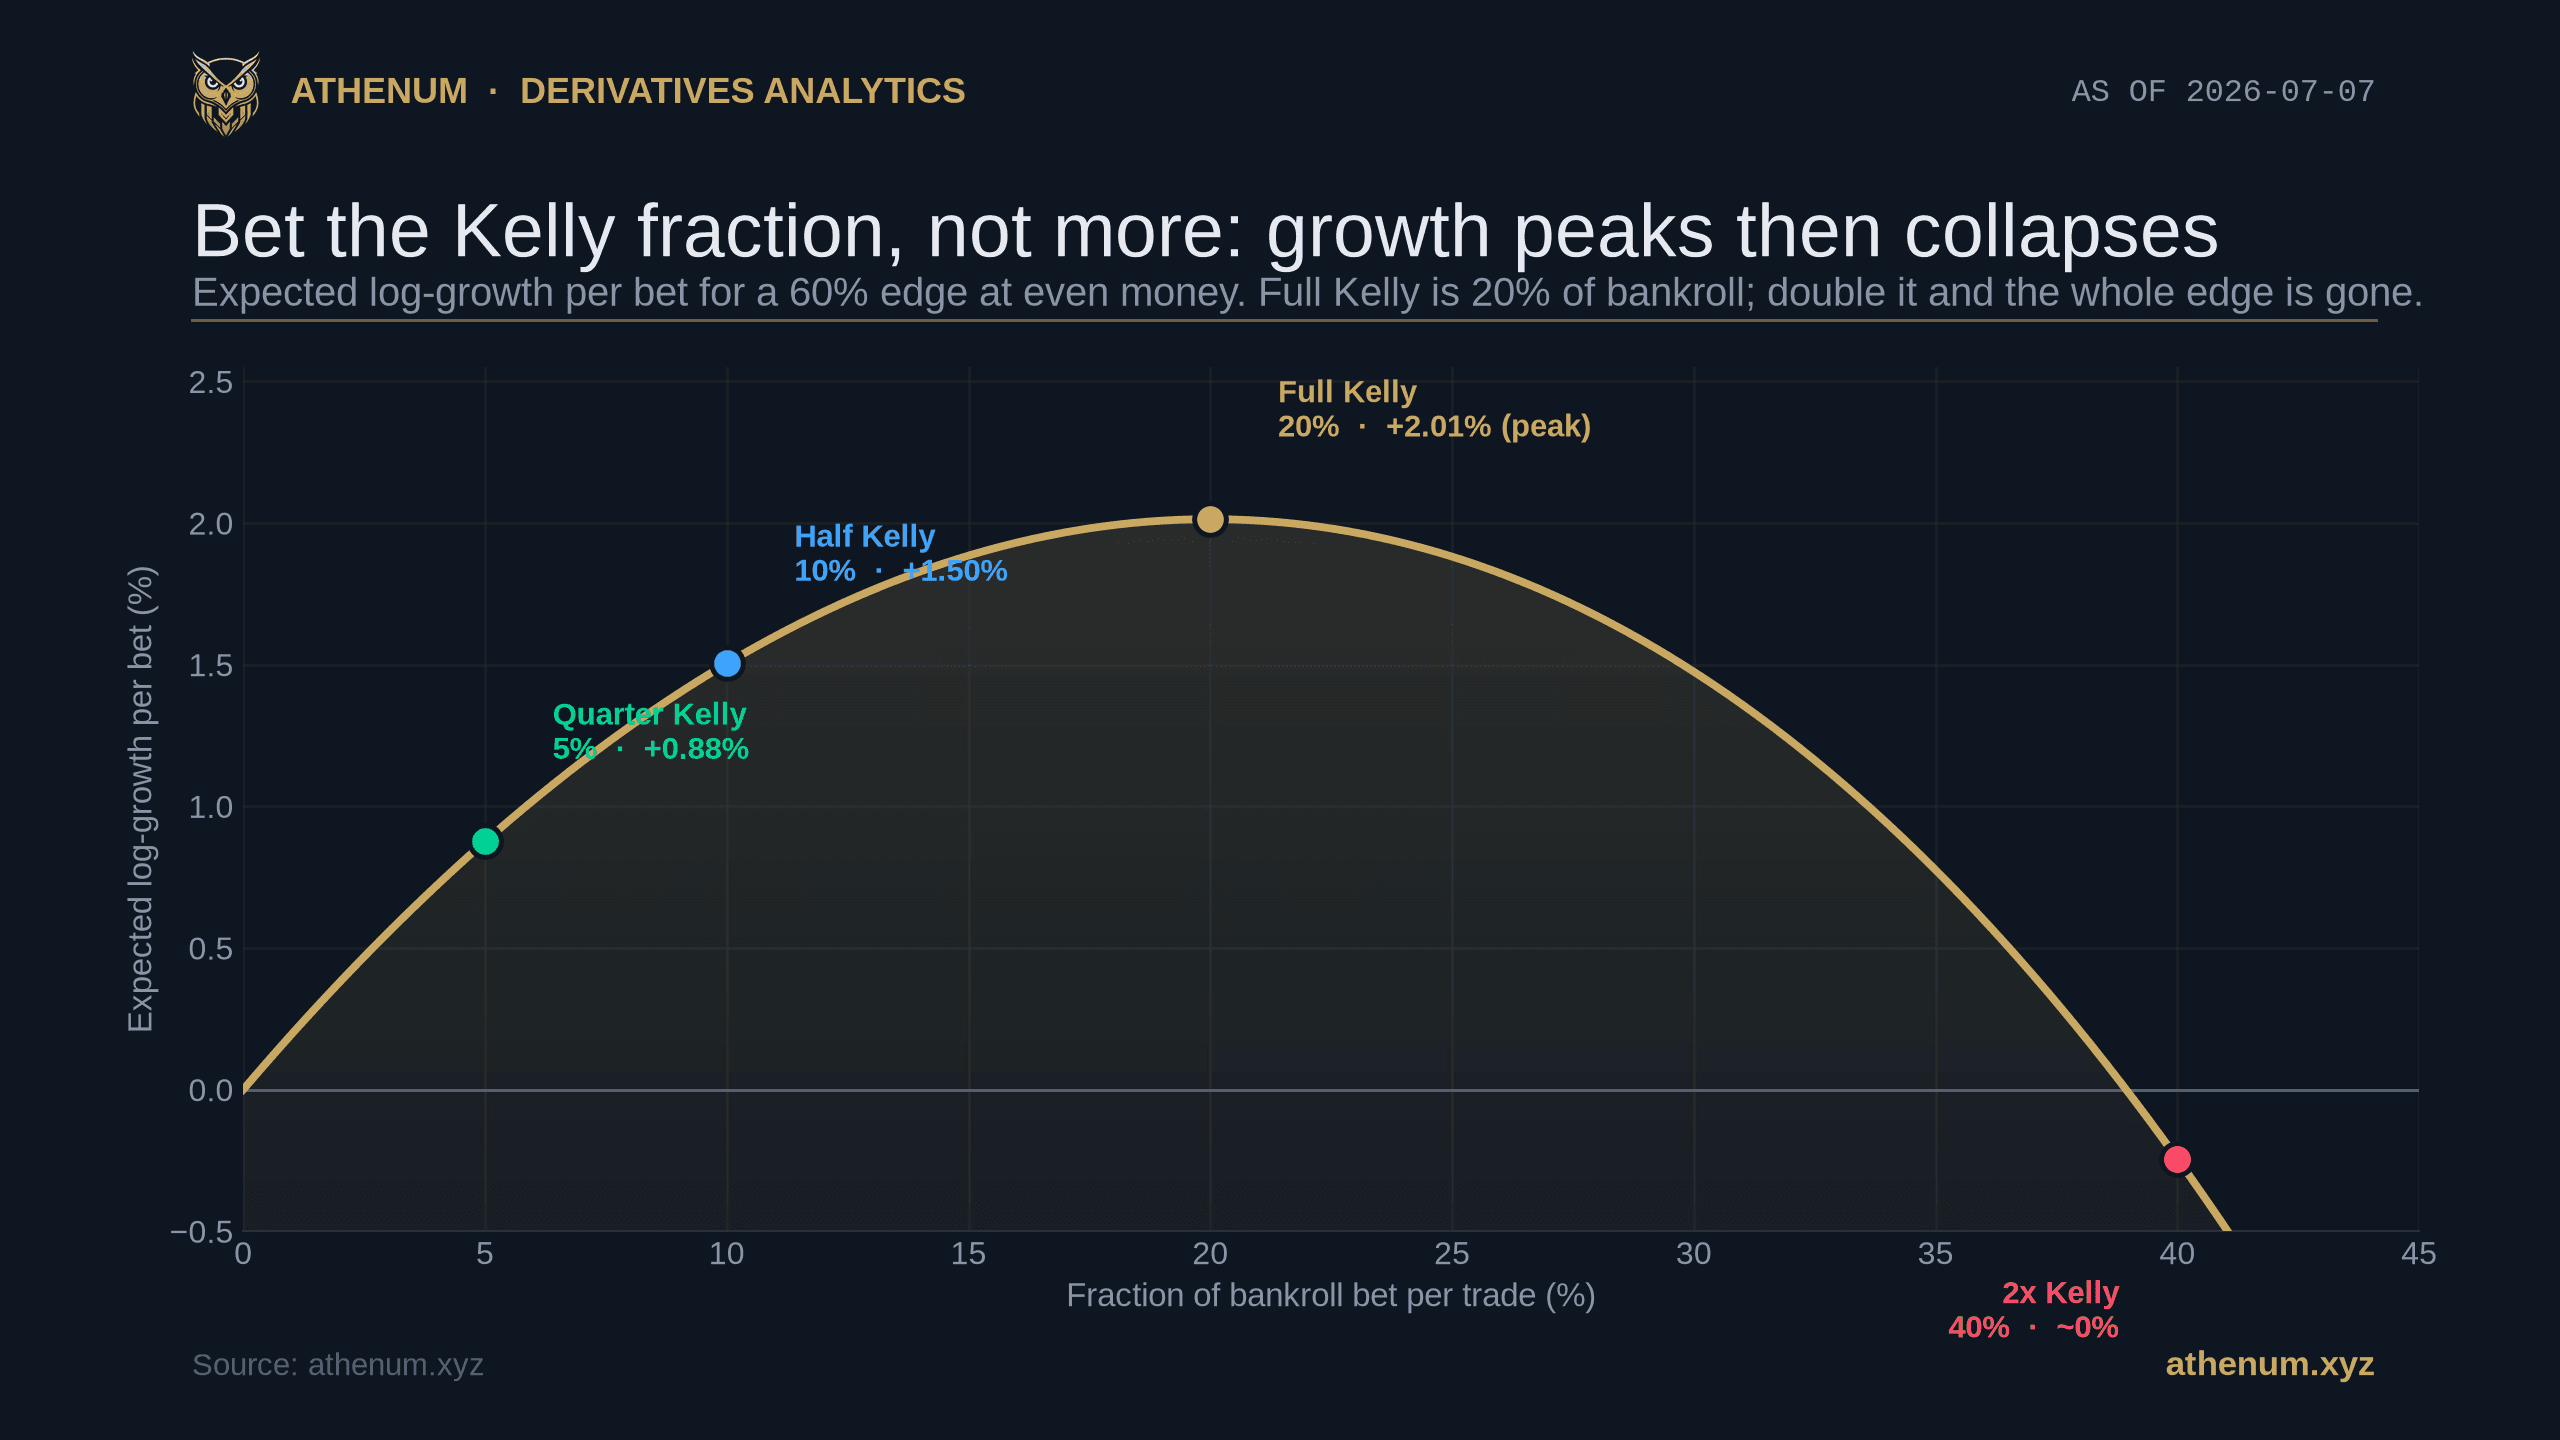
The Kelly Criterion for Crypto Position Sizing: How Big Should Each Trade Be?
The Kelly Criterion sets your optimal bet size from your win rate and payoff. Two worked crypto examples in the free Athenum calculator, plus why professionals bet half Kelly.
Athenum Analytics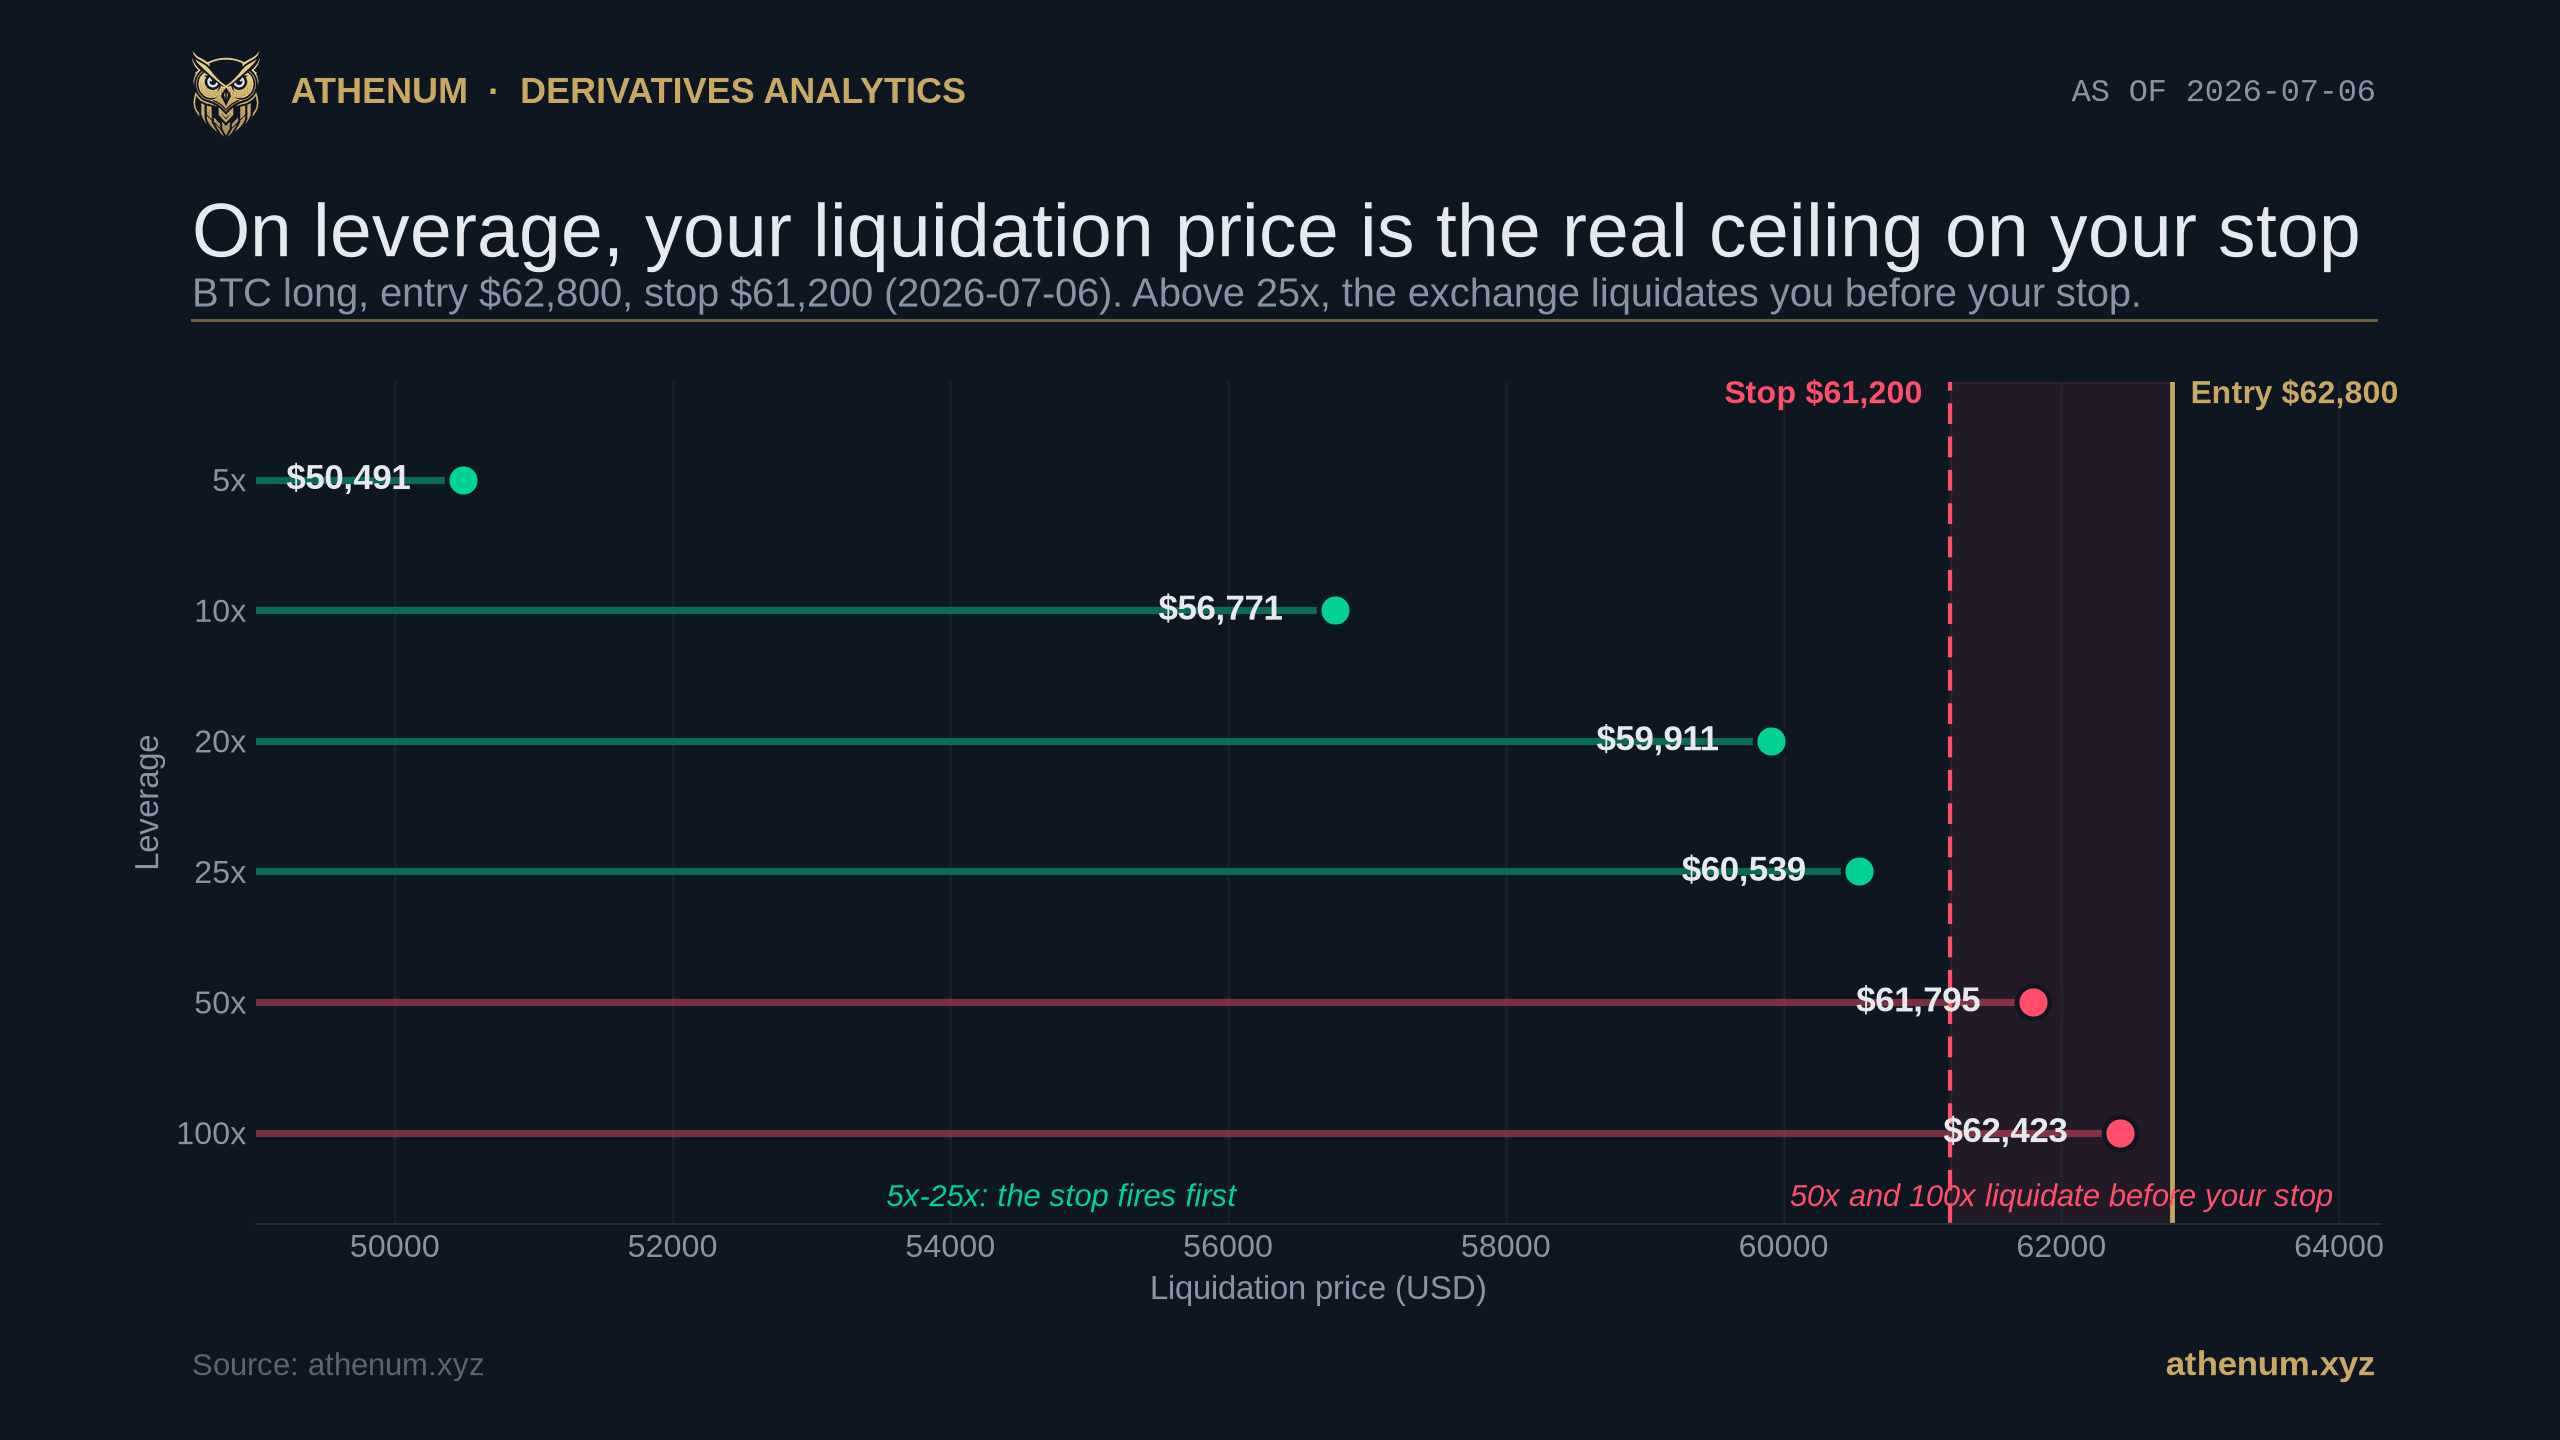
Risk/Reward Ratio in Crypto: How to Size a Leveraged Trade Around Your Liquidation Price
Your risk/reward ratio sets the win rate your system needs, and on leverage it also caps how wide your stop can be. A worked Bitcoin example with the free Athenum calculators.
Athenum Analytics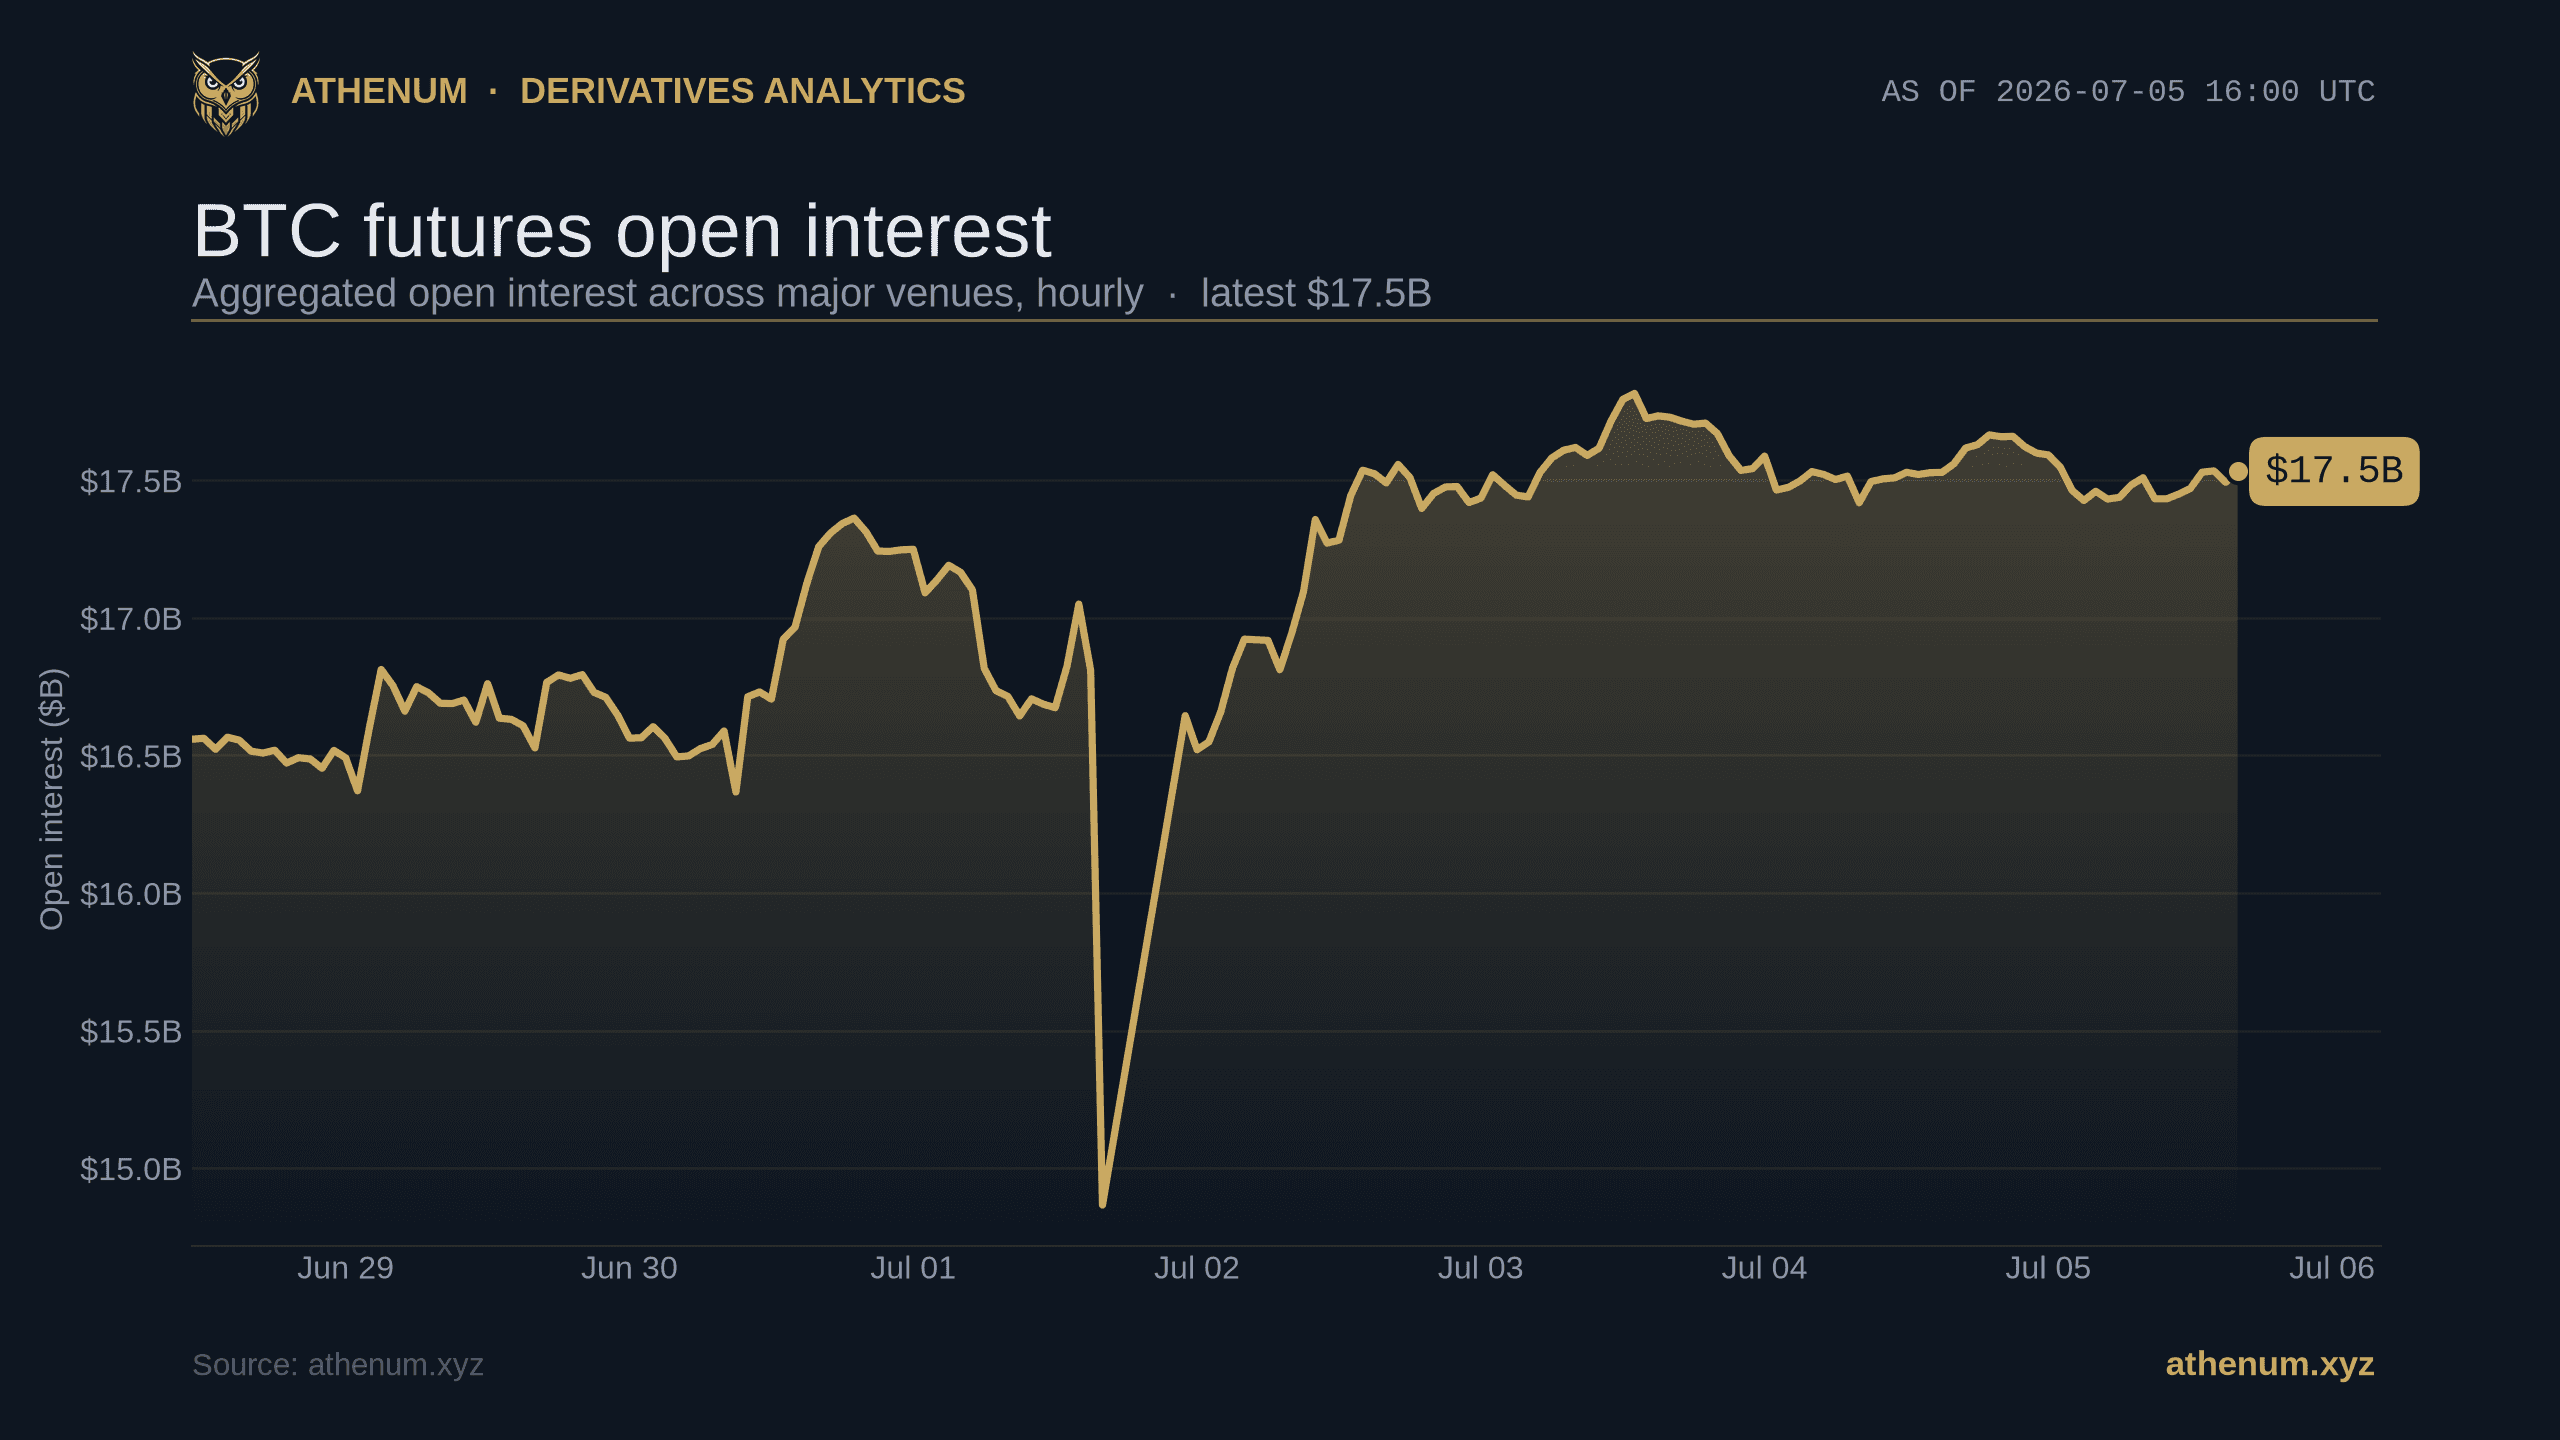
The Perp-to-Spot Volume Ratio: Is a Crypto Rally Leveraged or Real?
The perp-to-spot volume ratio compares perpetual turnover to spot volume. Learn to read it, what a normal ratio is, and if a crypto rally is leveraged or real.
Athenum Analytics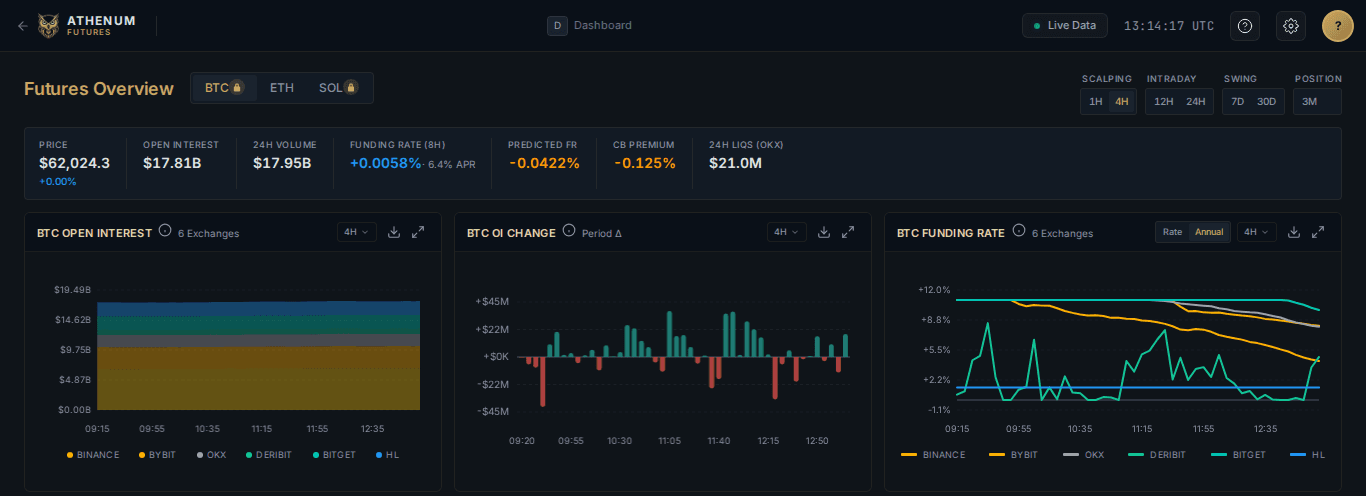
What Are Perpetual Futures? How Crypto Perps Stay Pinned to Spot
What are perpetual futures? Crypto contracts that never expire, held to spot by an 8 hour funding payment. How perps work, why funding exists, what they cost.
Athenum Analytics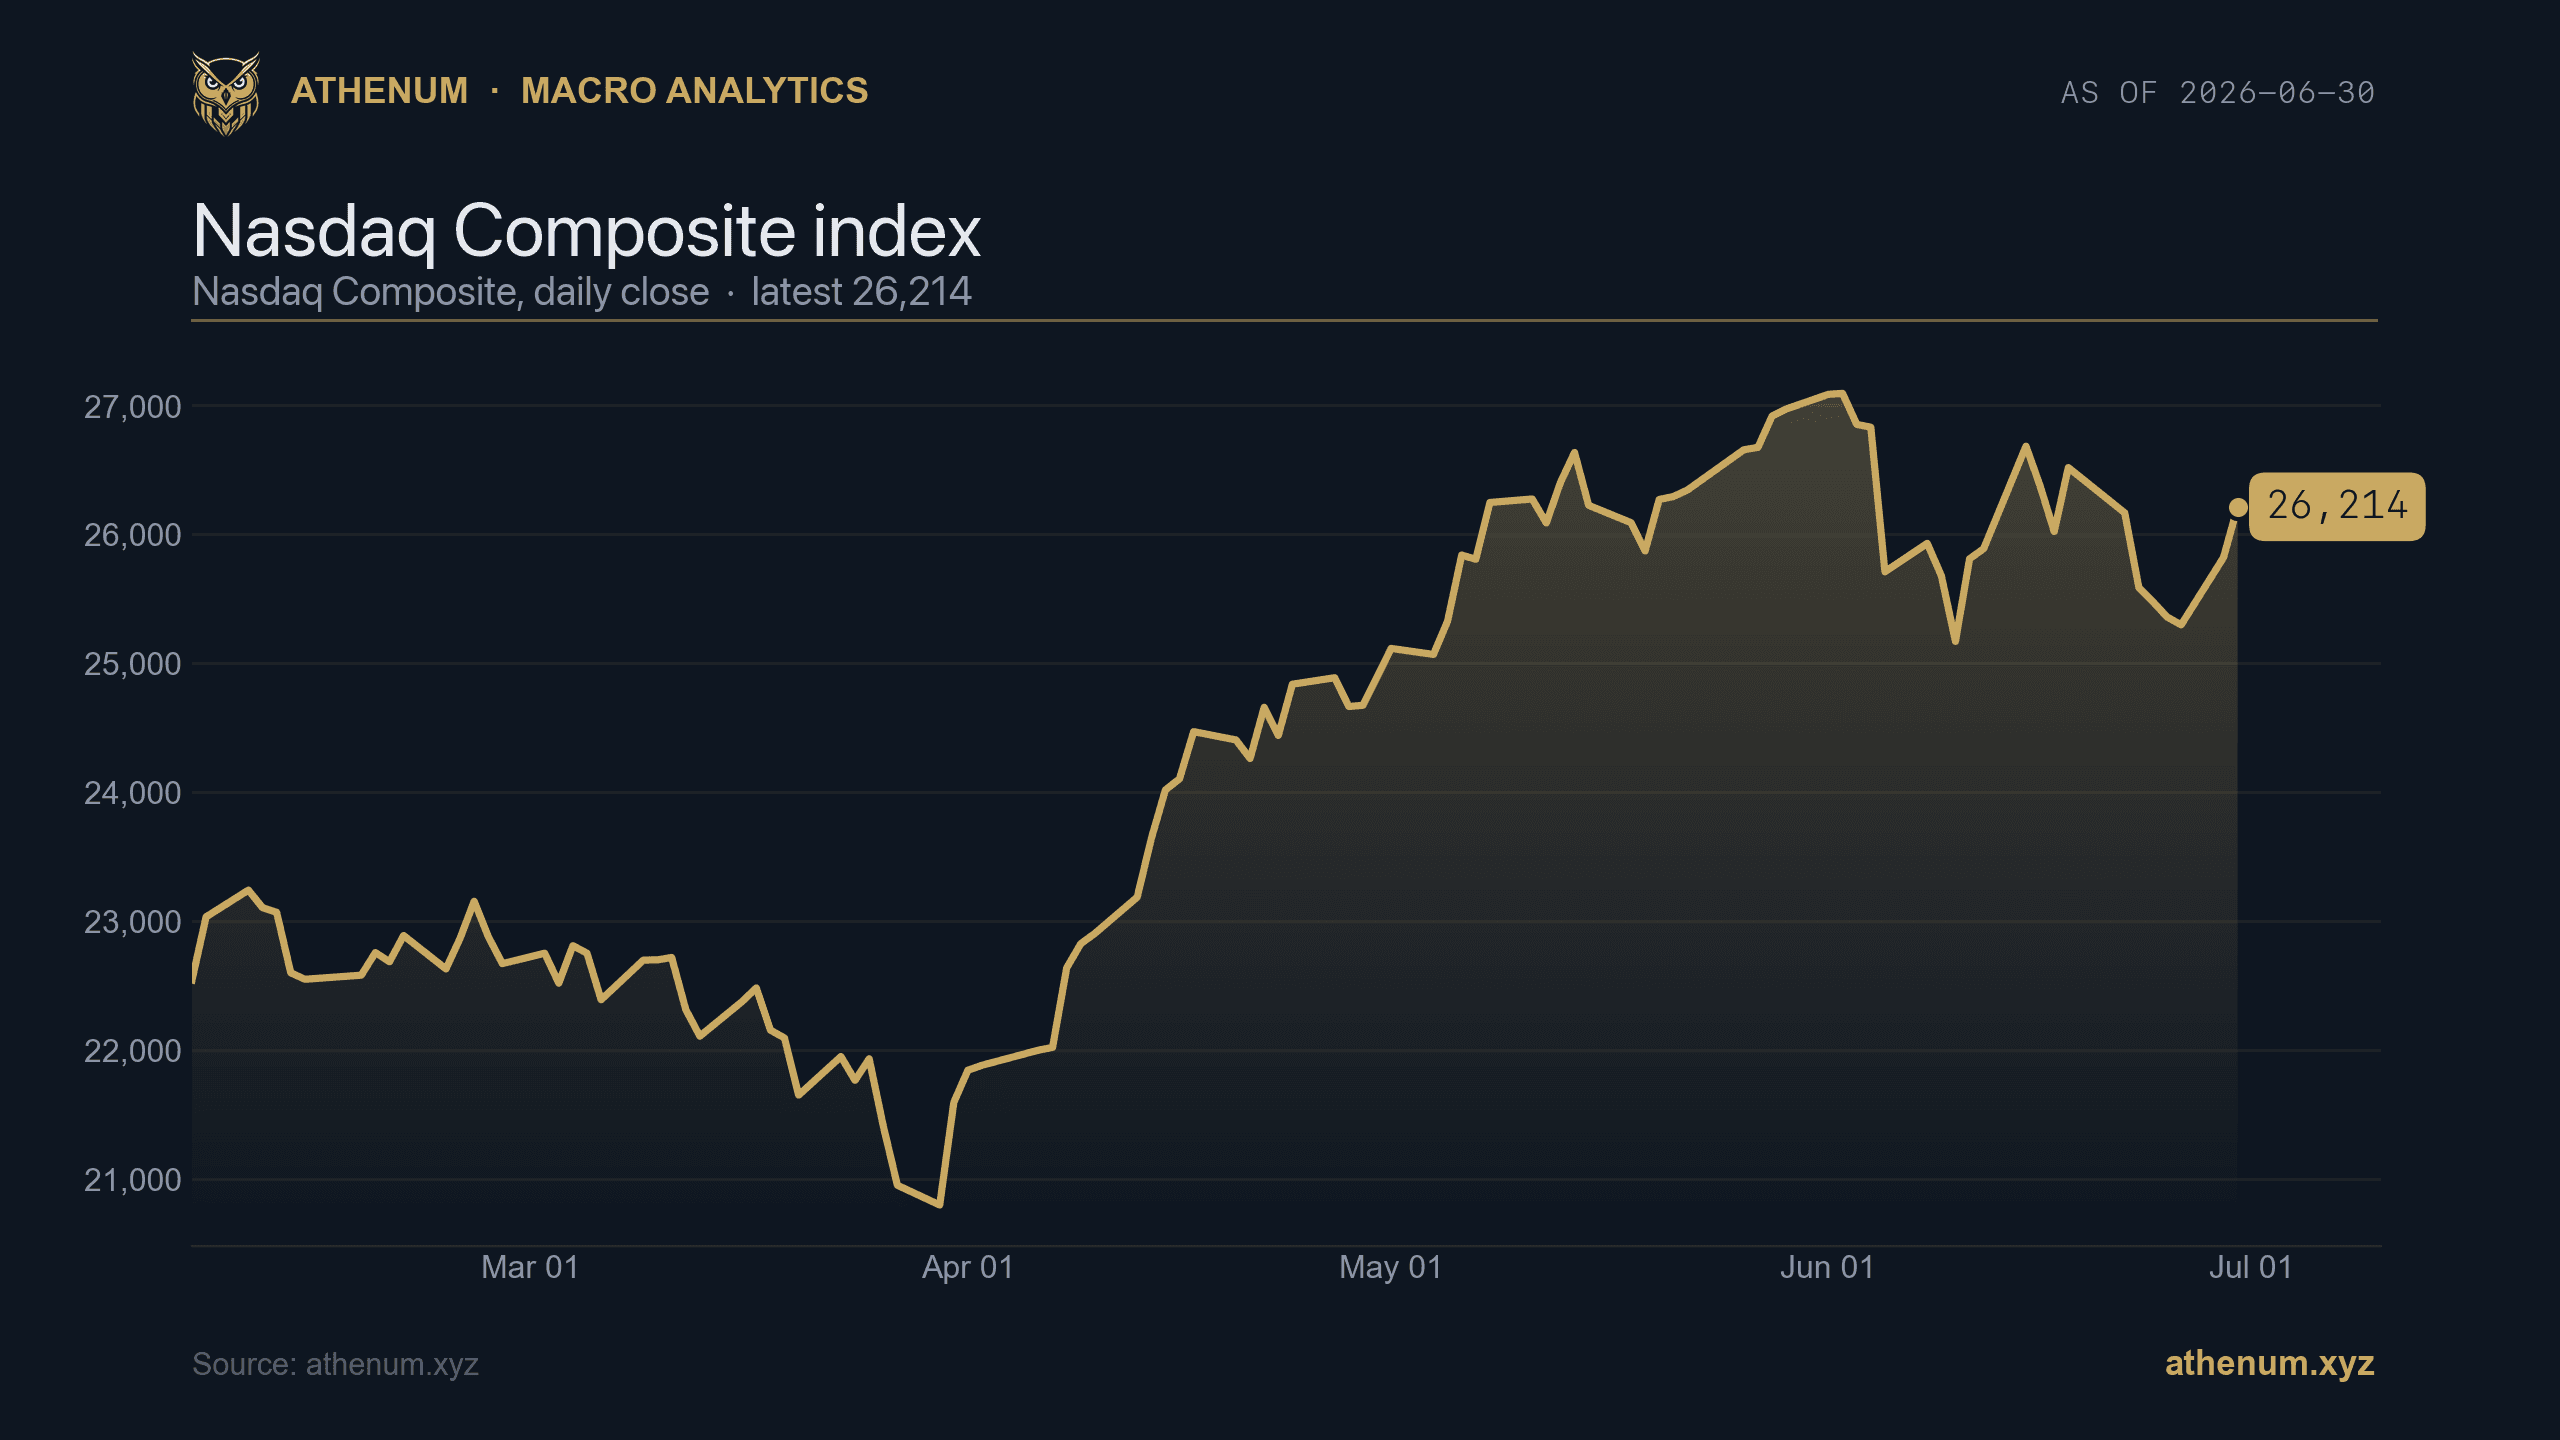
July 2026 Bitcoin–Nasdaq claim audit: what “0.96 correlation” cannot establish
This is a dated correction and evidence audit of our article first published on 1 July 2026. It preserves the claim's context rather than presenting an unsupported historical headline as a current market reading. The separate [Bitcoin–Nasdaq measurement guide](/blog/bitcoin-nasdaq-equity-correlation-macro-regimes/) explains a reproducible calculation.
Athenum Analytics